
On this page 8 sections
Key findings
- Ghost ads measure lift as precisely as conventional holdout tests at least ten times more cheaply (Johnson, Lewis & Nubbemeyer, 2017). [Experiment]
- In a ghost-ad test of display retargeting for an online retailer, the ads raised website visits by 17.2% and purchases by 10.5% (Johnson et al., 2017). [Experiment]
- A conclusive online advertising experiment can need more than 10 million person-weeks (Lewis & Rao, 2015). [Experiment]
- Synthetic controls are reliable only under specific conditions, including a good pre-period fit and enough comparison units (Abadie, 2021). [Methodological review]
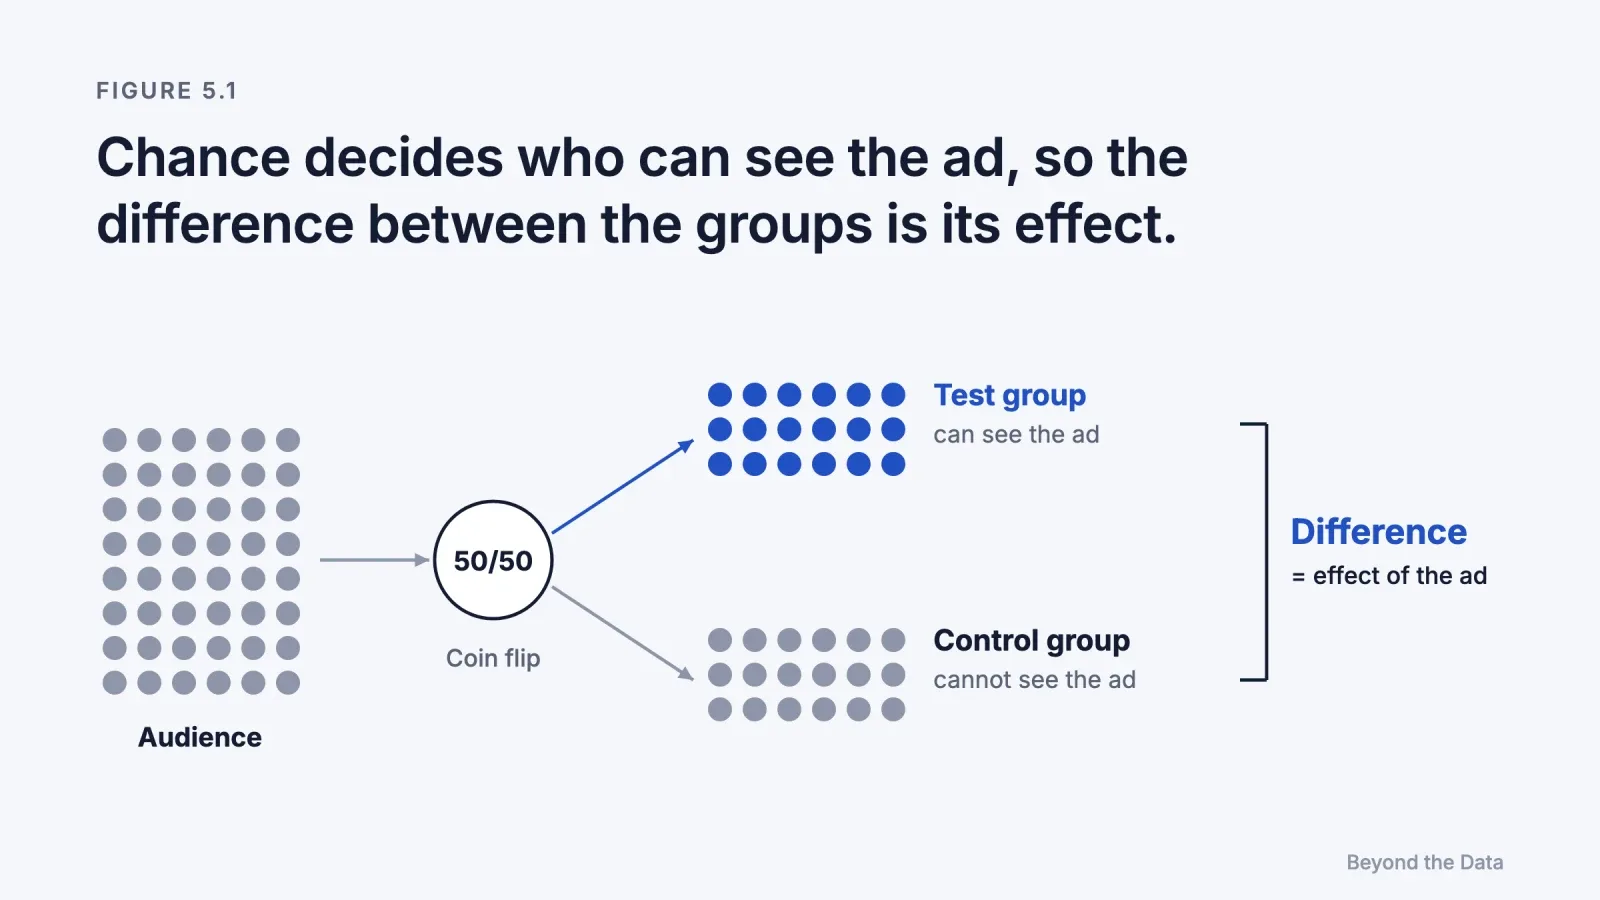
Short answer. Decide at random who can see the ad, then compare outcomes between the groups. Because chance alone decided exposure, the groups are alike in everything except the ad, and the difference estimates its causal effect. User-level holdouts, ghost ads and geographic experiments are the main designs. Each has a cost, a minimum size and a blind spot.
What is an incrementality test?
An incrementality test is an experiment that randomly withholds advertising from part of an audience or some regions and measures the difference in outcomes between the groups. The difference is the incremental effect: the sales that happened because of the ads. Dividing incremental revenue by spend gives incremental return on ad spend (iROAS), the number a budget decision actually needs.
The logic is the one introduced in Chapter 1. The effect of an ad is the gap between two worlds, with and without it. Random assignment creates both worlds at once, in two groups that differ only by chance and by the ad.
Which experimental designs exist?
| Design | Unit randomised | How the control group is formed | Main strength | Main blind spot |
|---|---|---|---|---|
| Intent-to-treat holdout | User | A random share of the target audience is never eligible for the ad | Simple and unbiased | Most people in both groups would never have seen the ad, so the signal is diluted |
| PSA (placebo) ads | User | Control users see an unrelated ad, such as a charity message | Identifies who would have been exposed | The advertiser pays for the placebo impressions; delivery algorithms may treat the two ads differently |
| Ghost ads | User | The platform logs control users who would have seen the ad, without showing anything | Precise and cheap | Requires the platform's cooperation; the advertiser cannot audit the implementation |
| Geo experiment | Region | Advertising is switched off or changed in randomly chosen regions | Measures total store sales, across all channels and offline | Needs many comparable regions; regions are noisy |
| Synthetic control | Region (often few) | A weighted combination of untreated regions imitates the treated one | Works when only one or a few regions can be treated | Not randomised; valid only if the pre-period fit is good |
| Budget-level test | Time or region | Budgets are set at random to different levels | Measures the marginal return, not just on/off | Needs several periods; effects can spill between periods |
Why are ghost ads important?
Because they solve the economics problem described in Chapter 1. In an ordinary holdout, the control group contains everyone in the target audience, including the many who would never have been reached. Their purchases add noise without adding information.
Johnson, Lewis and Nubbemeyer (2017) proposed recording, for each control user, the moment the ad system would have shown the ad, and then comparing only those "would-have-been-exposed" users with actually exposed ones. Their implementation logged more than 100 million predicted ghost ads per day. Compared with intent-to-treat and PSA designs, it measured lift just as precisely at a cost at least an order of magnitude lower. In their application to display retargeting, the ads increased website visits by 17.2% and purchases by 10.5%. [Experiment]
Two lessons follow. First, retargeting can work: this is a positive, experimentally measured effect. Second, it is far smaller than the gaps that naive comparisons of exposed and unexposed users produce, such as the 217% lift in the Facebook study in Chapter 4. The difference is the selection described there.
When should you use a geographic experiment?
When you want to measure total sales rather than tracked conversions, or when the platform cannot run a user-level test. A geo experiment changes advertising in some regions and compares total sales there with regions left untouched. Because it measures store sales from every source, it captures effects that tracking misses: buyers who saw a video and later searched, bought offline, or used another device.
A worked example shows both the power and the trap of geo tests.
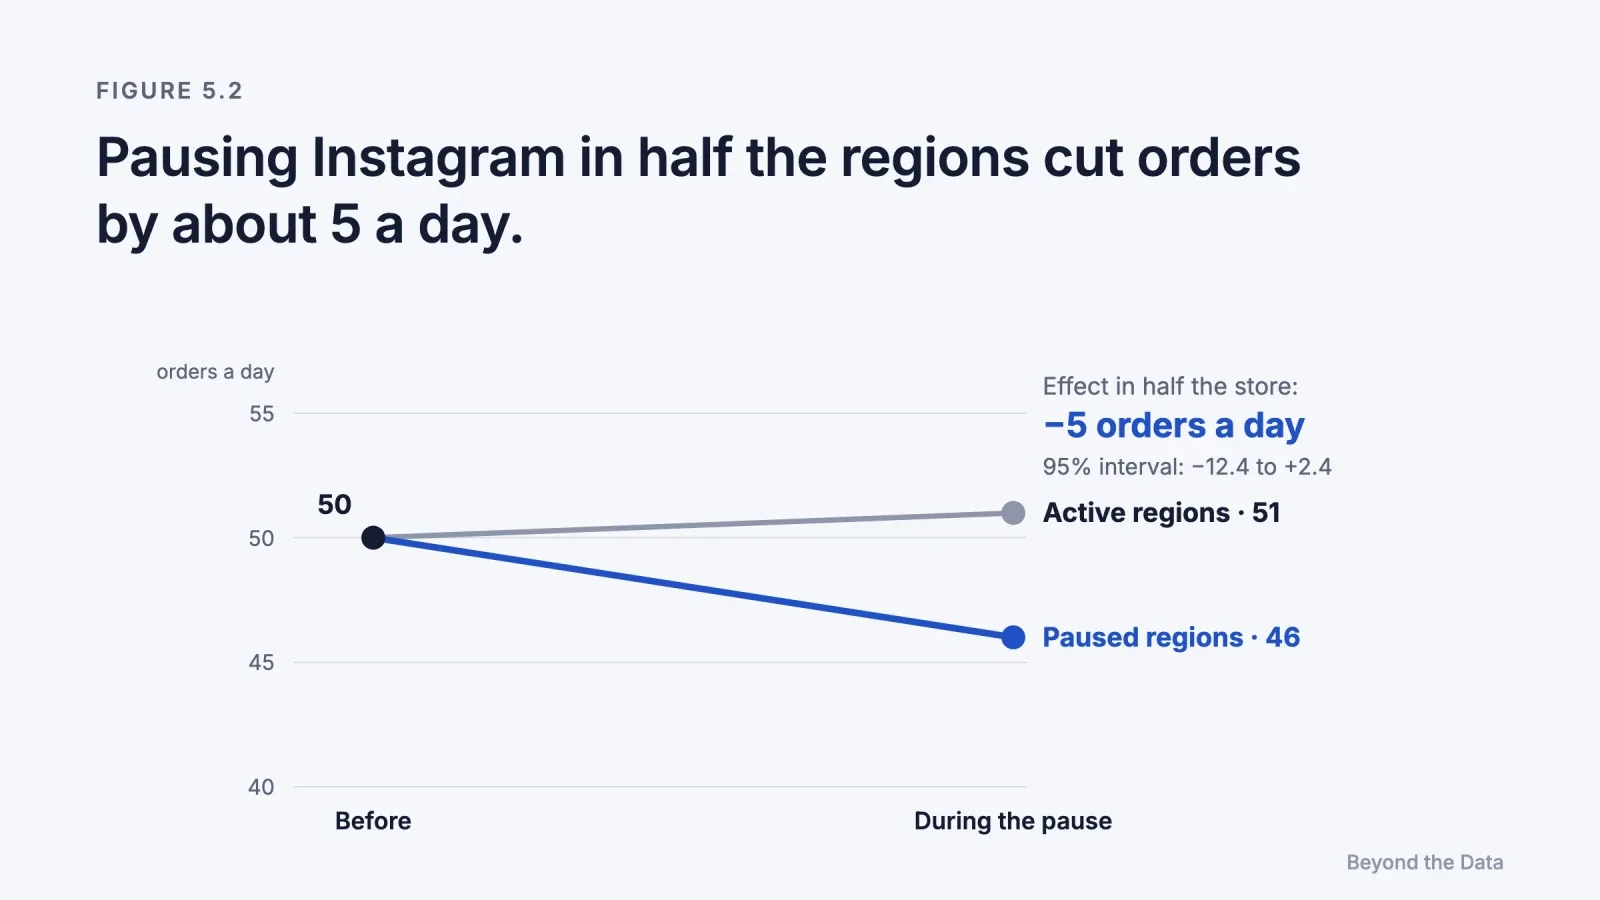
A store pauses Instagram in 4 of its 8 delivery regions, chosen by coin flip, for 14 days. In the 14 days before the pause, both groups averaged 50 orders a day. During the pause, the paused regions averaged 46 and the active regions 51.
- Change in paused regions: 46 − 50 = −4
- Change in active regions: 51 − 50 = +1
- Estimated effect in the paused half: −4 − (+1) = −5 orders a day
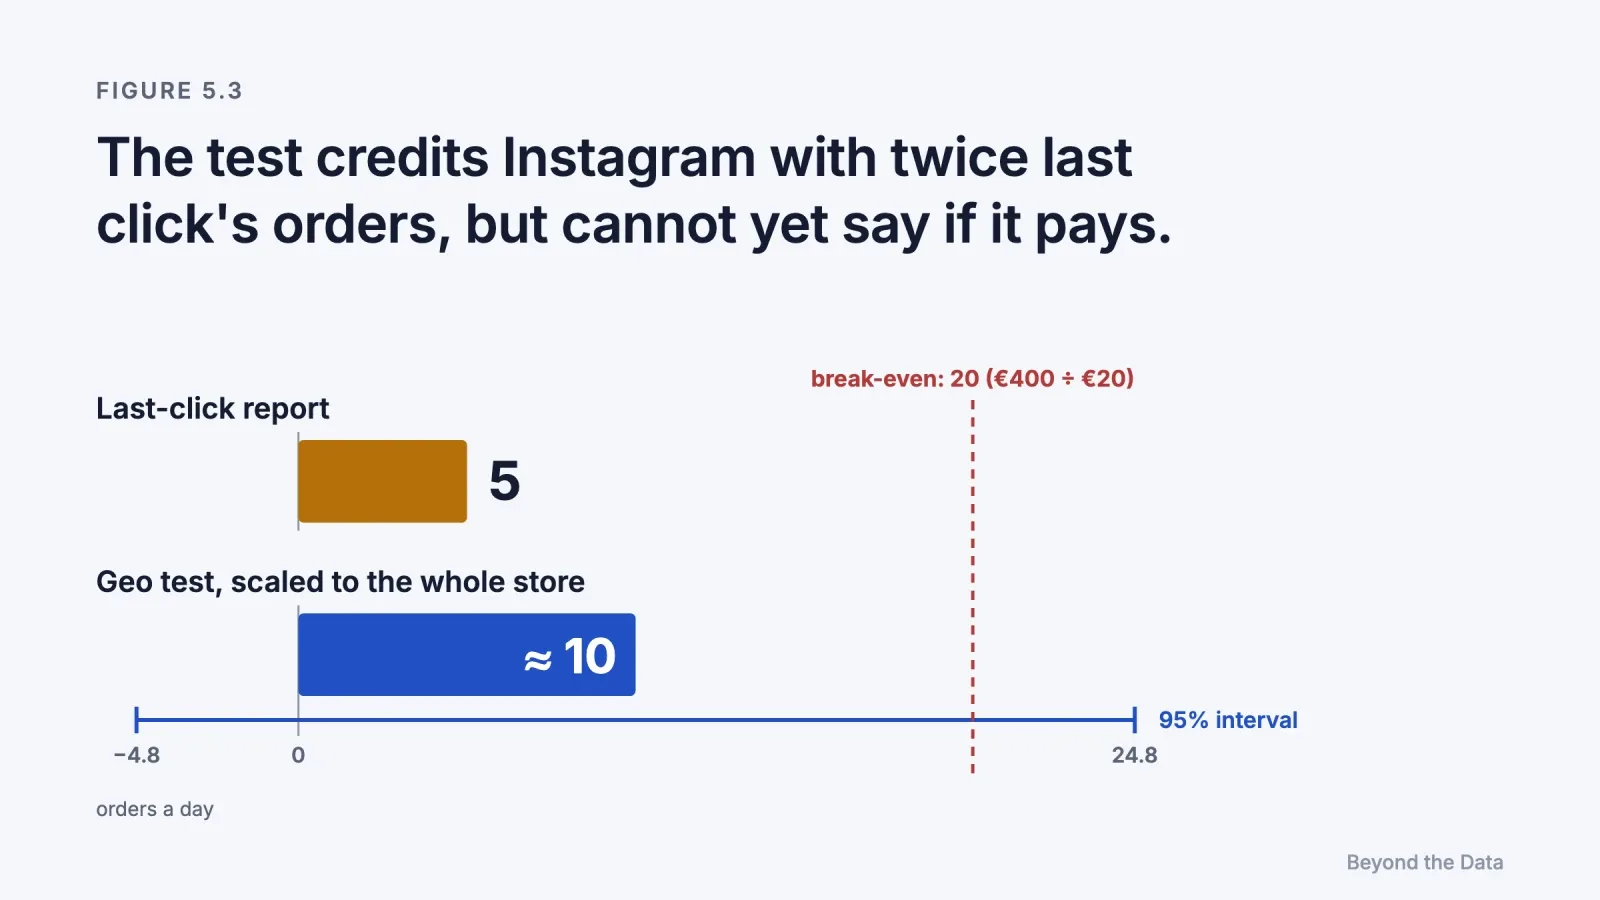
- Effect for the whole store (8 regions): about −10 orders a day
At €20 of profit per order, the central estimate puts Instagram's value at about €200 a day against €400 of daily spend. Last-click reports credit it with 5 orders a day, half of what the test estimates.
Illustrative example. An effect of about 10% of the store's orders is close to the purchase lifts in published experiments: a median of 5% for lower-funnel outcomes across 663 experiments (Chapter 4) and 10.5% for retargeting (above). Case 3 of the test in Chapter 8 uses the same design with a much larger effect.
Two steps are easy to get wrong. The active regions also moved, by +1, so the effect is the difference between the two changes, not the change in the paused regions alone. And the test covered half of the store, so the result has to be scaled to the whole store before it is compared with whole-store spend. Chapter 8 shows that AI analysts skipped the second step in most of their answers.
The estimate also needs an interval. If orders arrive independently of each other, a daily count that averages 50 varies by about √50 ≈ 7 orders, so the daily gap between two such groups varies by about √(50 + 50) = 10. The effect compares the average gap over the 14 days before the pause with the average gap over the 14 days of the pause:
- Standard error of each 14-day average gap: 10 ÷ √14 ≈ 2.7
- Standard error of the effect: √2 × 2.7 ≈ 3.8
- 95% interval in the paused half: −5 ± 1.96 × 3.8 → −12.4 to +2.4 orders a day
- Whole store: −24.8 to +4.8 orders a day, so Instagram's value lies between about −€96 and €496 a day
The interval runs from no effect to just above the €400 of spend. Fourteen days show that last click undercounts Instagram, but they cannot show whether Instagram pays for itself. With 6 weeks before and 6 weeks during the pause, the whole-store interval would narrow to about €30–€370 a day if the central estimate held, below the spend at both ends. Even that interval is optimistic: it assumes that days are independent and that the only noise is the chance arrival of orders, while real regions also differ in weather, delivery and local events. Effects that arrive after the test ends are missed (Chapter 6). The formulas are in Appendix F.
Meta's open-source GeoLift package was built for this design, and Brodersen and colleagues' CausalImpact package supports time-series versions of it.
What makes an experiment trustworthy?
Random assignment removes selection bias but not every error. The literature on online experiments (Kohavi, Tang & Xu, 2020) recommends a short list of checks, which apply directly to advertising tests.
- Decide the metric and the duration before starting. Stopping when the result looks good inflates false positives.
- Check the split. If the groups do not have the sizes the design intended, something in the assignment is broken, and the result should not be trusted.
- Measure total outcomes. Use store revenue or orders, not platform-attributed conversions, which inherit the problems of Chapter 2.
- Allow for delay. Some effects arrive weeks after exposure. A test that stops too early understates them.
- Know who randomised. A platform's lift test is an experiment, but its exposed group is chosen by the platform's delivery algorithm, so comparisons between two ads are subject to the divergent delivery problem (Braun & Schwartz, 2025).
- Report the interval, not only the estimate. With the noise levels in Chapter 1, an honest result often includes both a loss and a large gain.
What can't an experiment tell you?
[Our reading] An experiment answers one question well: what this campaign, in this period, for this audience, caused. It does not answer three others.
- Other budgets. Switching a channel off says what the channel is worth at its current spend. It does not say what the next €1,000 would bring.
- Other times. Effects change with seasons, creative and competition. An experiment from last spring is evidence about last spring.
- Other channels. Testing one channel at a time misses interactions between them, which Chapter 3 showed can be large.
Varian (2016) makes the general case that business decisions require exactly this counterfactual reasoning, and that experiments, where feasible, are the most direct route to it. The practical problem is that a business cannot run an experiment for every channel, at every budget level, every month.
The limit of this chapter
Experiments are local and expensive. A budget decision needs more than an on/off answer for one channel: it needs to know how returns change as spend rises, how long effects take to arrive, and how channels interact. Chapter 6 asks how budget should follow evidence.
References
- Abadie, A. (2021). Using synthetic controls: Feasibility, data requirements, and methodological aspects. Journal of Economic Literature, 59(2), 391–425. doi:10.1257/jel.20191450
- Braun, M., & Schwartz, E. M. (2025). Where A/B testing goes wrong. Journal of Marketing, 89(2), 71–95. doi:10.1177/00222429241275886
- Brodersen, K. H., Gallusser, F., Koehler, J., Remy, N., & Scott, S. L. (2015). Inferring causal impact using Bayesian structural time-series models. Annals of Applied Statistics, 9(1), 247–274. doi:10.1214/14-AOAS788
- Johnson, G. A., Lewis, R. A., & Nubbemeyer, E. I. (2017). Ghost ads: Improving the economics of measuring online ad effectiveness. Journal of Marketing Research, 54(6), 867–884. doi:10.1509/jmr.15.0297
- Kohavi, R., Tang, D., & Xu, Y. (2020). Trustworthy Online Controlled Experiments: A Practical Guide to A/B Testing. Cambridge University Press. doi:10.1017/9781108653985
- Lewis, R. A., & Rao, J. M. (2015). The unfavorable economics of measuring the returns to advertising. Quarterly Journal of Economics, 130(4), 1941–1973. doi:10.1093/qje/qjv023
- Meta. GeoLift: open-source geo experimentation. https://github.com/facebookincubator/GeoLift
- Varian, H. R. (2016). Causal inference in economics and marketing. Proceedings of the National Academy of Sciences, 113(27), 7310–7315. doi:10.1073/pnas.1510479113
 Edip Ali Avcıbaşı · Co-founder & CAOCo-founder and CAO of Meerkads and Byte Digital. Has run agency operations since 2020, with a background in digital marketing, SEO and marketplaces.