
On this page 6 sections
Appendix A · Evidence table
The main studies cited in this book, by rung of the evidence ladder.
| Study | Design | Scale | Main finding | Rung | Chapter |
|---|---|---|---|---|---|
| Lodish et al. (1995) | Split-cable TV experiments | 389 tests | Raising budgets relative to competitors does not generally raise sales | 2 | 1 |
| Sethuraman et al. (2011) | Meta-analysis | 56 studies, 1,153 elasticities | Average elasticity 0.12 short term, 0.24 long term | 1 | 1 |
| Lewis & Rao (2015) | Field experiments | 25 experiments, $2.8M | Median ROI interval wider than 100 points; >10M person-weeks for a conclusive test | 2 | 1, 5 |
| Shapiro et al. (2021) | Observational, TV | 288 brands | Marginal ROI negative for >80% of brands; total ROI positive for about a third | 1 | 1, 6 |
| Lewis, Rao & Reiley (2011) | Field experiments with placebo | 3 experiments | Activity bias inflates observational estimates | 2 | 1, 4 |
| Kraft et al. (2023) | Observational | Billions of impressions, 8 countries | Trackable US Apple traffic fell from 73% to 22% after ATT | 0 | 2 |
| Berman (2018) | Game-theoretic model | Last touch over-incentivises impressions and can lower profit | Model | 2, 4 | |
| Blake et al. (2015) | Field experiment, eBay | National | Brand search: 99.5% of clicks recovered organically; non-brand: regression >4,100% vs experiment −63% | 2 | 3, 4 |
| Lewis & Nguyen (2015) | Field experiment | Display raises brand searches 30–45% | 2 | 3 | |
| Anderl et al. (2016) | Markov attribution | 4 data sets | Credit differs markedly from last click; carryover and spillover | 1 | 3 |
| Gordon et al. (2019) | Experiments vs observational | 15 experiments, 1.6B impressions | Observational methods off by ≥3× in half the studies | 2 vs 1 | 4 |
| Gordon et al. (2023) | Experiments vs observational | 663 experiments | Lower-funnel lift 5% vs 24% (DML) and 64% (matching) | 2 vs 1 | 4 |
| Braun & Schwartz (2025) | Analytical | Divergent delivery biases platform A/B tests | 2 | 4, 5 | |
| Johnson et al. (2017) | Ghost-ad experiments | 100M+ ghost ads per day | ≥10× cheaper at equal precision; retargeting +10.5% purchases | 2 | 5 |
| Danaher & van Heerde (2018) | Model | Optimal allocation does not depend on past exposure, attribution does | Model | 6 | |
| Naik & Raman (2003) | Model, market data | Dockers | Synergy: raise spend, shift some toward the less effective medium | 1 | 3, 6 |
| Jin et al. (2017) | Bayesian MMM | Simulation and case | Carryover and shape; priors dominate in small samples | 3 | 6, 7 |
| Gordon et al. (2026), PIE | Experiment-calibrated model | 2,226 experiments | R² 0.88 vs 0.19 for 7-day last click | 3 | 3, 7 |
| Jin et al. (2023) | LLM benchmark | 200,000+ items, 17 models | Most models near chance on correlation-to-causation | AI | 8 |
| Hu et al. (2026), AD-Bench | LLM agent benchmark | Real platform requests | Best model 76.9%, hardest level 61.4% | AI | 8 |
Appendix B · Glossary (English / Turkish)
| English | Turkish | Meaning |
|---|---|---|
| Attribution model | Attribution modeli | A rule that divides credit for a sale among ads and channels |
| Credit | Kredi (pay) | The share of a sale a report assigns to an ad |
| Cause / causal effect | Neden / nedensel etki | The sales that would disappear without the ad |
| Counterfactual | Karşı-olgu | What would have happened in the world without the ad |
| Incrementality | Artımsallık | The additional outcome caused by advertising |
| iROAS | Artımsal ROAS | Incremental revenue divided by spend |
| Holdout | Holdout (dışarıda tutulan grup) | A randomly chosen group that does not receive ads |
| Ghost ads | Ghost ads (hayalet reklam) | Logging control users who would have seen an ad |
| Geo experiment | Bölgesel deney | Changing advertising in randomly chosen regions |
| Synthetic control | Sentetik kontrol | A weighted mix of untreated units that imitates a treated one |
| Selection bias | Seçilim yanlılığı | Exposed and unexposed groups differ before the ad |
| Activity bias | Etkinlik yanlılığı | Active users both see more ads and do more of everything |
| Divergent delivery | Ayrışan dağıtım | A platform shows each ad version to a different audience |
| Marginal return | Marjinal getiri | Profit from the next unit of spend |
| Saturation | Doygunluk | Returns fall as spend rises |
| Carryover / adstock | Gecikmeli etki | Advertising effect that continues after the spend |
| Synergy / complementarity | Sinerji / tamamlayıcılık | Channels raise each other's effect |
| Media mix model (MMM) | Medya karması modeli | Model of total sales on spend by channel over time |
| Calibration | Kalibrasyon | Correcting a measure with experimental results |
| Evidence ladder | Kanıt merdiveni | This book's ordering of measurement methods by question |
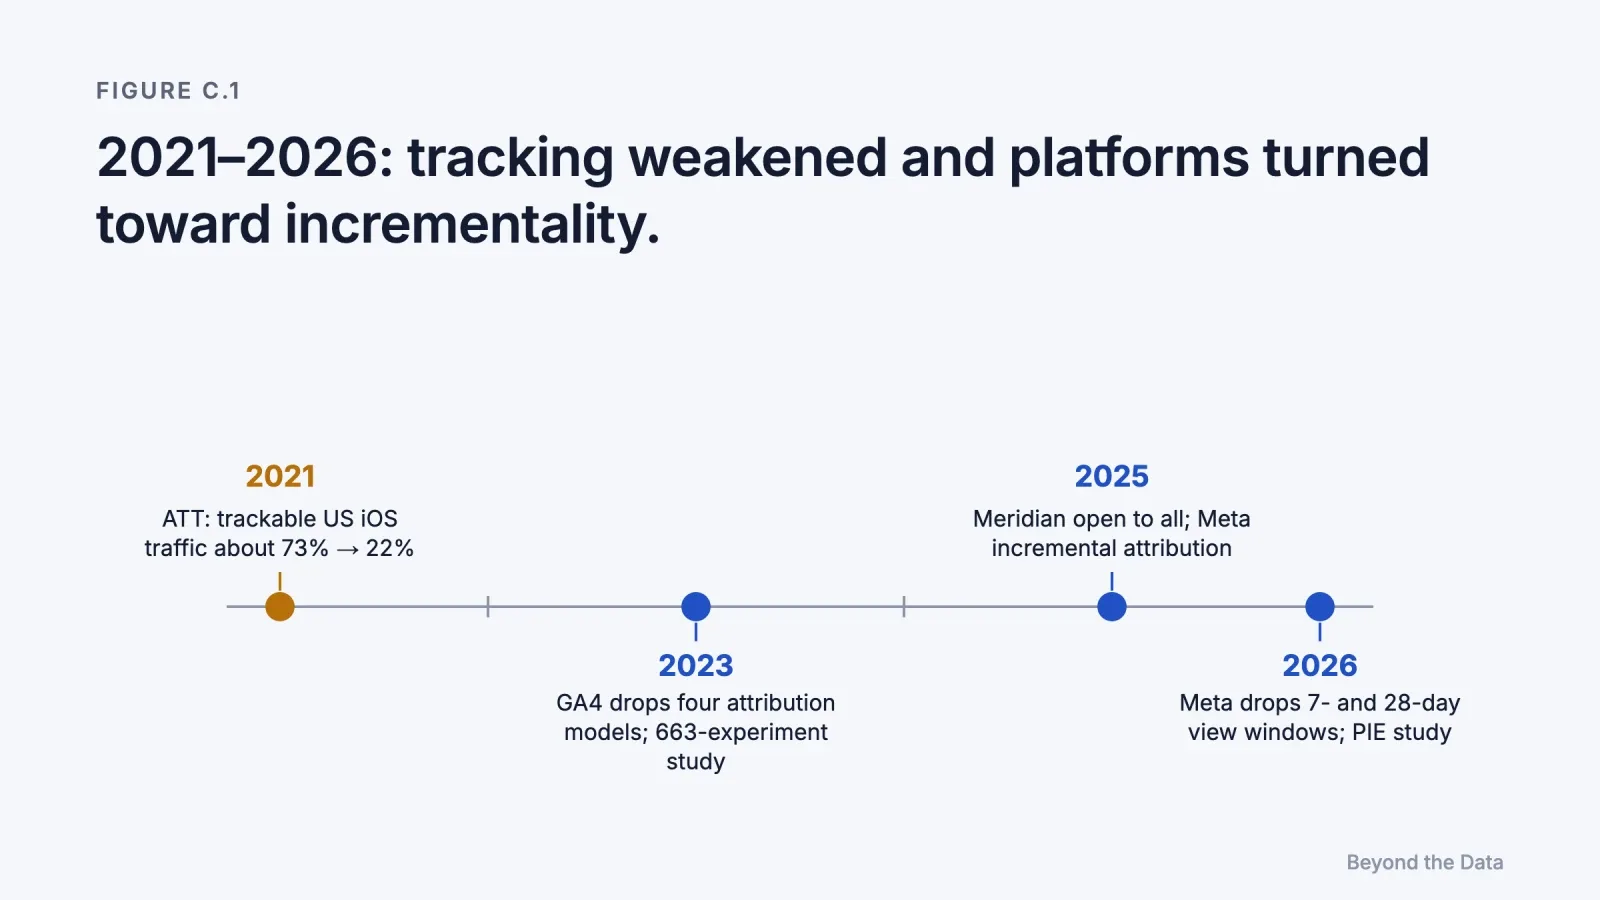
Appendix C · Timeline, 2021–2026
| Year | Change | Source |
|---|---|---|
| 2021 | Apple ATT: trackable US iOS traffic falls from about 73% to 22% | Kraft et al. (2023) |
| 2023 | Google removes four rule-based attribution models; 663-experiment study shows ML cannot reliably estimate ad effects observationally | Google; Gordon et al. (2023) |
| 2025 | Google Meridian open to all; Meta incremental attribution | Google (2025); Meta (2026) |
| 2026 | Meta stops returning 7-day and 28-day view windows; PIE: last click explains 19% of incremental variation | Meta (2025); Gordon et al. (2026) |
[Our reading] Over this period, tracking weakened and platforms moved from dividing credit toward estimating incremental effects. Whether click-based attribution has become less accurate over time is a hypothesis, not a measured trend.
Appendix D · Test materials for Chapter 8
D.1 Prompt (version 3, cue-free), given verbatim
You are a marketing analyst. Below are six independent cases from six different online stores. For each case, tell the store owner what you would do. Use only the information given. Do not search the web.
Case 1. Last 30 days. Total ad spend €24,000: Meta €12,000, Google Ads €8,000, TikTok €4,000. Platform-reported revenue: Meta €49,200 (ROAS 4.1), Google Ads €28,800 (ROAS 3.6), TikTok €8,800 (ROAS 2.2). Total store revenue for the month (Shopify): €71,000. Contribution margin: 40%.
The owner wants to switch TikTok off and move its €4,000 to Meta, "because Meta's ROAS is almost twice TikTok's."
Case 2. Over the last 8 weeks the store ran a budget experiment. Each week, the budget of Channel X and the budget of Channel Y were each set at random, independently, to either €2,000 or €3,000. Average weekly store revenue:
| Weeks where… | Average weekly store revenue |
|---|---|
| X at €2,000 | €40,100 |
| X at €3,000 | €41,300 |
| Y at €2,000 | €39,300 |
| Y at €3,000 | €42,100 |
Platform-reported ROAS over the same period: Channel X 5.0, Channel Y 3.0. Half of revenue is profit before ad costs. Both channels now run at €2,500 a week.
The owner can add €1,000 a week to one channel and plans to give it to Channel X, "because X has the higher ROAS."
Case 3. Daily averages over the last month: Instagram spend €400, Google Search spend €600. Last-click report: Search 75 orders a day, Instagram 5, direct and organic 20. Store total: 100 orders a day. Each order brings €20 of profit before ad costs.
Two weeks ago the store paused Instagram in 4 of its 8 delivery regions, chosen by coin flip, for 14 days. During those 14 days the paused regions averaged 26 store orders a day in total, and the active regions averaged 51. In the 14 days before the pause, both groups averaged 50 orders a day. Search clicks in the paused regions also fell by about half.
The owner asks whether to switch Instagram off everywhere.
Case 4. Google Ads reports 300 conversions last month on €9,000 of spend. Each order brings €45 of profit before ad costs. Last quarter the store ran a randomised conversion-lift test on the same campaigns, which have not changed since. The test estimated that the ads caused 92% of the conversions Google reported (95% interval: 80% to 104%).
A consultant says: "Google always takes credit for sales that would have happened anyway. Switch Google Ads off."
Case 5. The store spends €5,000 a month on a YouTube campaign. The agency dashboard, using 7-day click attribution, shows €6,000 of YouTube revenue (ROAS 1.2). Half of revenue is profit before ad costs. Last spring the store switched YouTube off for 6 weeks in randomly chosen regions and compared total store revenue. That test estimated YouTube's incremental revenue at €15,000 per €5,000 of spend, mostly arriving 2 to 5 weeks after exposure. The campaign and targeting have not changed since.
The agency recommends cutting YouTube "because a ROAS of 1.2 is below your break-even of 2.0."
Case 6. The store spends €2,000 a month on retargeting website visitors. The platform's audience report says visitors who saw a retargeting ad converted at 4.0% within 30 days, while visitors who did not see one converted at 1.0%.
The agency proposes doubling the budget because retargeting "quadruples the conversion rate."
Answer format. For each case, write two or three sentences addressed to the owner. Start each answer with "Case N:".
D.2 Answer key and scoring rule
| Case | Correct decision | Reasoning |
|---|---|---|
| 1 | Do not move the budget; test incrementality first | Platform claims €86,800 exceed store revenue €71,000, so platform ROAS figures overlap and cannot rank channels |
| 2 | Give the extra €1,000 to Y | X: +€1,200 revenue → €600 profit < €1,000. Y: +€2,800 → €1,400 profit > €1,000 |
| 3 | Keep Instagram | Paused 50→26 (−24), active 50→51 (+1); effect −25 in half the store → about −50 orders a day store-wide × €20 = €1,000 > €400 |
| 4 | Keep Google Ads | 0.92 × 300 = 276 × €45 = €12,420 > €9,000; low end 240 × €45 = €10,800 > €9,000 |
| 5 | Keep YouTube | Incremental ROAS 3.0 > break-even 2.0 |
| 6 | Do not scale; run a holdout first | The 4× gap can come from targeting selection |
Scoring: in cases 1 and 6, an answer is correct only if it rejects the proposal and recommends an incrementality test before deciding; cautioning and then accepting the proposal is wrong. In cases 3 and 5, "increase" scores half a point. In case 4, "keep" and "increase" are correct.
Appendix E · Method of this book
Source selection. Peer-reviewed articles, working papers from recognised series (NBER, arXiv, SSRN), platforms' own documentation, and industry reports. Management magazines may inform framing but are never a source of numbers. A number enters the text only from a source whose abstract or full text was read; second-hand figures were traced to the original or dropped. The one exception is Lodish et al. (1995): its average elasticity and significance figures are given as reported in the working paper of Shapiro et al. (2021), whose full text was consulted, and the text says so.
Labels. Every claim carries an evidence label (Experiment, Observational, Model, Platform, Experiment vs observational, Analytical, Methodological review, Textbook principle, Industry survey, Benchmark, Our test, Our reading). Inferences are marked as "Our reading".
Platform sources. When a source is written by platform employees or uses platform data, this is noted at the citation.
Conflict of interest. The author is a co-founder of Meerkads, which builds advertising analytics software, including tools that let AI assistants read advertising data. No Meerkads data or product is used or described in this book.
Version. First edition, November 2026. Corrections will be listed with the date of change.
Appendix F · Formulas
This appendix collects the arithmetic behind the examples. Notation: R is revenue, S ad spend, Q orders or sales, m profit before ad costs as a share of revenue, and p profit per order.
F.1 Lift and incremental outcome (Chapters 4 and 5)
- Lift = (test average − control average) ÷ control average, where each average is the outcome per person or per region in that group.
- Incremental outcome = (test average − control average) × number of people or regions in the test group.
F.2 Incremental return and break-even (Chapters 5 and 6)
- iROAS = incremental revenue ÷ spend.
- Profit after ad costs = m × incremental revenue − S. Break-even iROAS = 1 ÷ m.
- With orders as the outcome: profit = p × incremental orders − S; break-even orders = S ÷ p.
- Examples: YouTube, m = 0.5, break-even 2.0, iROAS 15,000 ÷ 5,000 = 3.0, profit 0.5 × 15,000 − 5,000 = €2,500 a month (Chapter 6). Instagram, break-even 400 ÷ 20 = 20 orders a day (Chapter 5).
F.3 Difference in differences (Chapter 5)
- Effect = (test during − test before) − (control during − control before).
- Example: (46 − 50) − (51 − 50) = −5 orders a day.
- Assumption: without the change, both groups would have moved in parallel.
F.4 Scaling a partial test (Chapter 5)
- Whole-business effect = test effect ÷ k, where k is the test regions' share of the business, measured in orders before the test.
- Example: k = 0.5, so −5 ÷ 0.5 = −10 orders a day.
- Assumption: the effect is proportional to size, and the test regions are representative.
F.5 Standard error and 95% interval (Chapters 5 and 6)
- An average of n independent observations with standard deviation σ has standard error SE = σ ÷ √n.
- A difference between two independent estimates has SE = √(SE₁² + SE₂²).
- 95% interval ≈ estimate ± 1.96 × SE. With few observations, replace 1.96 by the t-value for the available degrees of freedom: 2.57 for 5.
- A count of independent events with mean μ has standard deviation √μ (Poisson).
- Geo example: daily gap SD = √(50 + 50) = 10; SE of each 14-day average gap = 10 ÷ √14 = 2.67; SE of the effect = √(2.67² + 2.67²) = 3.78; interval −5 ± 7.4 in the paused half, then × 2 for the whole store.
- Budget example: SE = 500 × √(1/4 + 1/4) = €354; for Y − X, SE = √(354² + 354²) = €500.
- Lift-test example: the interval on the caused share scales the count, 300 × 0.80 = 240 and 300 × 1.04 = 312 orders (Chapter 6).
F.6 How long a geo test must run (Chapter 5)
- With n days before and n days during, the half-width of the 95% interval for a difference in differences is h = 1.96 × σ × √(2 ÷ n), so n = 2 × (1.96 × σ ÷ h)².
- Example: σ = 10, n = 42 gives h = 4.3 orders in the paused half, 8.6 for the whole store, about ±€171 a day at €20 an order.
- With 8 regions there are 70 ways to choose 4. A randomisation test that compares the actual split with all of them cannot give a one-sided p-value below 1 ÷ 70 ≈ 0.014.
F.7 Average and marginal return (Chapter 6)
- Average ROAS = R ÷ S.
- Marginal return ≈ Δ*R* ÷ Δ*S* for a change Δ*S* in spend.
- Profit from each extra euro = m × Δ*R* ÷ Δ*S* − 1.
- Example: X, 0.5 × 1,200 ÷ 1,000 − 1 = −0.4; Y, 0.5 × 2,800 ÷ 1,000 − 1 = +0.4; that is −€400 and +€400 per extra €1,000.
F.8 Elasticity (Chapter 1)
- ε = (Δ*Q* ÷ Q) ÷ (Δ*S* ÷ S), the percentage change in sales for a 1% change in advertising.
- Example: ε = 0.12 and a 10% budget increase give about 0.12 × 10% = 1.2% more sales.
F.9 Carryover and diminishing returns (Chapters 6 and 7)
- Carryover (adstock), in a common form: *a*ₜ = *x*ₜ + λ × *a*ₜ₋₁, with 0 ≤ λ < 1, where *x*ₜ is this period's spend. Part of past spend still works this period.
- Shape: sales respond to f(a), a curve that rises ever more slowly. For such a curve starting at zero, the marginal return f′(a) is below the average f(a) ÷ a.
- Jin et al. (2017) use more general versions of both.
F.10 Shapley value (Chapter 3)
- For channel i among n channels, with v(T) the extra sales when only the channels in set T advertise: φᵢ = Σ over sets T without i of [|T|! × (n − |T| − 1)! ÷ n!] × [v(T with i) − v(T)].
- With two channels, this is the average of a channel's contribution when it comes first and when it comes second.
- Chapter 3 example, counting units above the 20 sold without advertising: v(none) = 0, v(Instagram) = 10, v(Search) = 30, v(both) = 80. Instagram: ½ × 10 + ½ × (80 − 30) = 30. Search: ½ × 30 + ½ × (80 − 10) = 50. The shares sum to 80, while switching each channel off loses 50 and 70. The split rests on assumptions about how the interaction is shared.
 Edip Ali Avcıbaşı · Co-founder & CAOCo-founder and CAO of Meerkads and Byte Digital. Has run agency operations since 2020, with a background in digital marketing, SEO and marketplaces.