
On this page 7 sections
Key findings
- In 15 large Facebook experiments, observational methods missed the experimental purchase lift by a factor of three or more in half of the studies, usually overstating it (Gordon et al., 2019). [Experiment vs observational]
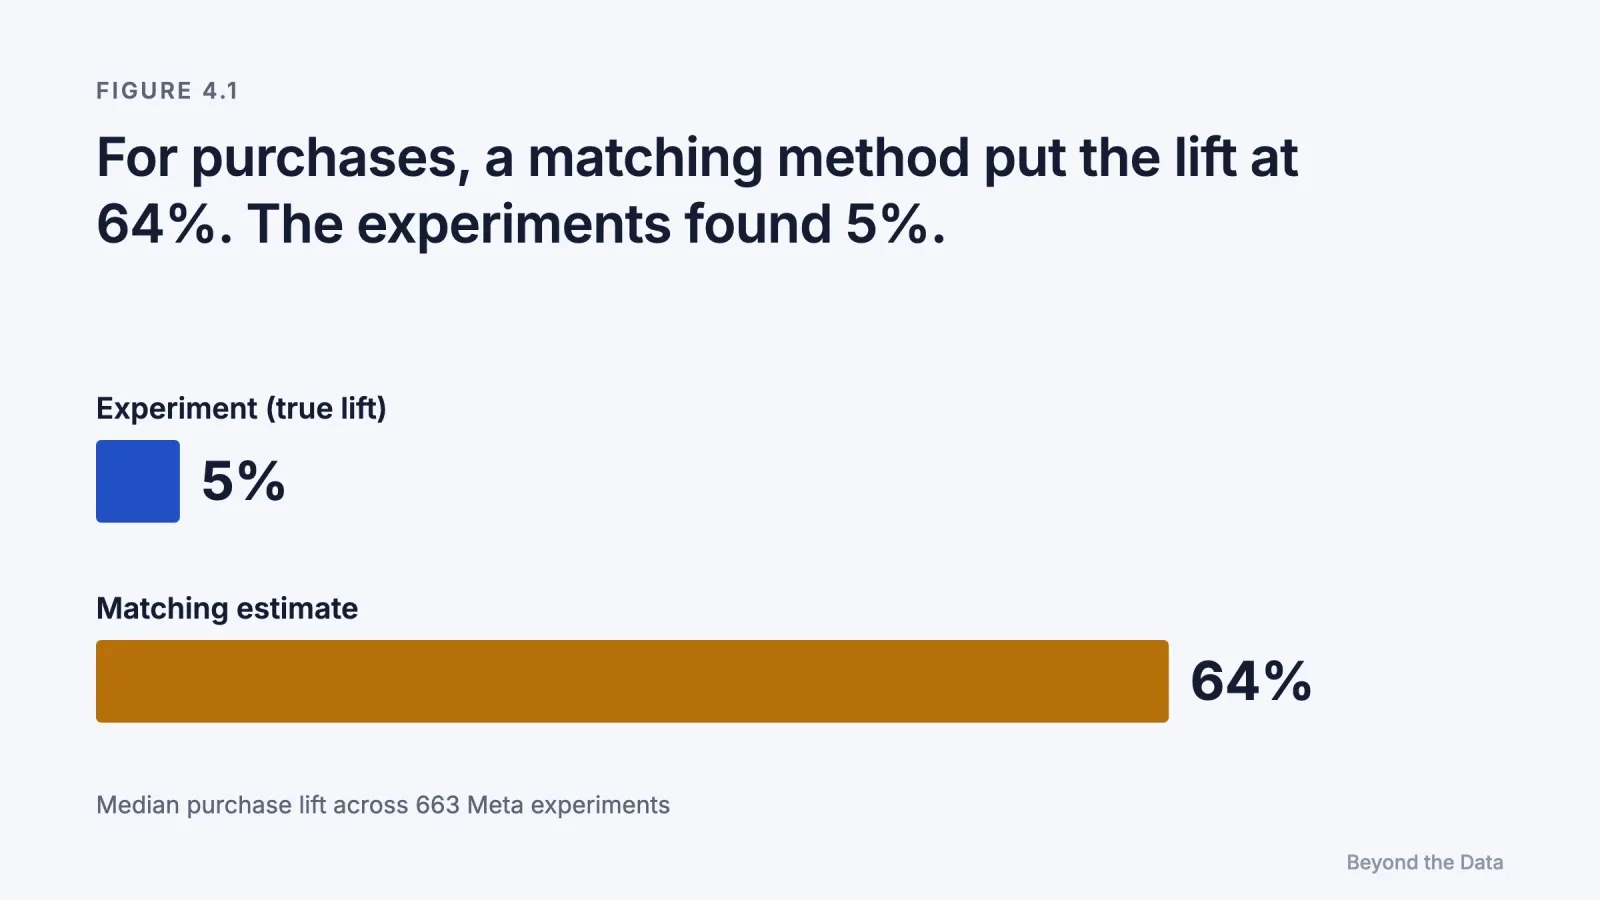
- Across 663 Meta experiments, the median true lift for lower-funnel campaigns was 5%; a machine-learning estimator put it at 24% and a matching estimator at 64% (Gordon et al., 2023). [Experiment vs observational]
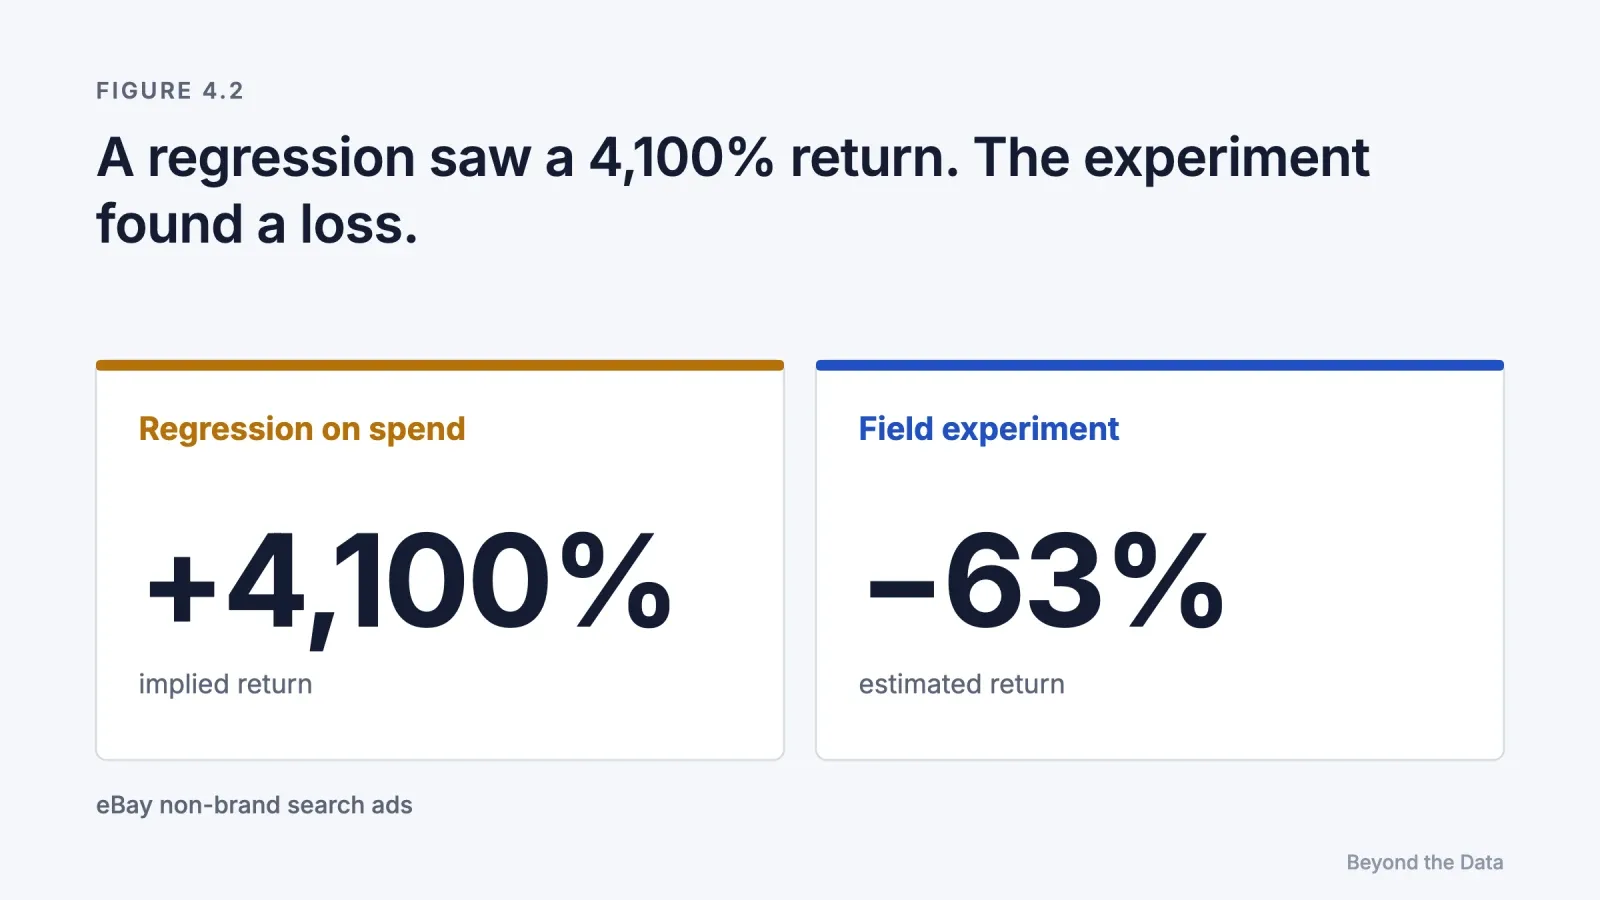
- For eBay's non-brand search ads, a standard regression implied a return of over 4,100%; the experiment found −63% (Blake et al., 2015). [Experiment vs observational]
- Platform A/B tests compare ads shown to different, algorithmically chosen audiences, which can reverse the sign of a result (Braun & Schwartz, 2025). [Analytical]
Short answer. Because the people who see an ad differ from the people who don't in ways that also predict buying. Platforms target likely buyers, active users see more of everything, and algorithms deliver different ads to different audiences. Statistical controls reduce these differences but do not remove them. When the same campaigns were measured both ways, observational methods typically overstated the experimental effect, often several times over.
What is an observational measurement?
An observational measurement estimates the effect of an ad from data in which nobody controlled who saw it. It compares exposed and unexposed people, or periods with more and less advertising, and adjusts for observed differences between them. Attribution models, dashboards, before-and-after comparisons, regressions and most media mix models are observational.
The question is not whether observational methods are useful. They are often the only option. The question is how wrong they tend to be, and in which direction. Advertising offers an unusual opportunity to answer it, because platforms have run thousands of randomised experiments whose true answers can be compared with what observational methods would have estimated from the same data.
How far apart are observational estimates and experiments?
Far enough to change decisions.
Gordon, Zettelmeyer, Bhargava and Chapsky (2019) used 15 US advertising experiments at Facebook, covering 500 million user-experiment observations and 1.6 billion impressions. For each experiment, they applied the observational methods a well-equipped analyst would use, from simple exposed-versus-unexposed comparisons to matching and regression on rich user data, and compared the result with the experiment. In half of the studies, every observational method they tried missed the experimental purchase lift by a factor of three or more. The errors were usually overstatements, sometimes understatements, and no method was reliably better than the others. In one study, the naive comparison of exposed and unexposed users implied a lift of 217%. [Authors declare they received no payment from Facebook]
Gordon, Moakler and Zettelmeyer (2023) repeated the exercise at scale, with 663 experiments.
| Funnel stage of outcome | Experimental median lift | Double machine learning | Stratified propensity score matching |
|---|---|---|---|
| Upper funnel | 29% | 83% | 173% |
| Mid funnel | 18% | 58% | 176% |
| Lower funnel (e.g., purchase) | 5% | 24% | 64% |
Even with rich user-level data and modern machine-learning methods, the authors conclude that the causal effect of a campaign could not be estimated reliably from observational data. [Experiment vs observational; authors include a Meta employee and part-time Meta researchers]
Blake, Nosko and Tadelis (2015) reached the same conclusion for search. For eBay's non-brand keyword ads, a standard regression of sales on search spending suggested a return above 4,100%, still above 1,400% with controls. The field experiment estimated a return of −63% (95% interval −124% to −3%). Most of the ad spending went to frequent eBay users whose purchases did not depend on the ads.
Where does the overstatement come from?
Four mechanisms account for most of it.
| Mechanism | What happens | Evidence |
|---|---|---|
| Targeting selection | Platforms show ads to people already likely to buy, so exposed people would have bought more even without the ad | Lewis & Rao (2015); Blake et al. (2015) |
| Activity bias | People who are very active online on a given day see more ads and also do more of everything, including visiting the advertiser | Lewis, Rao & Reiley (2011) |
| Divergent delivery | In platform A/B tests, each ad version is delivered by the algorithm to a different set of users, so the comparison mixes ad content with audience | Braun & Schwartz (2025) |
| Measurement pressure | When a number becomes a target, the system adapts to move the number, including algorithms that optimise toward attributed conversions | Campbell (1979); Berman (2018) |
The first two biases push estimates upward. Divergent delivery can push them either way, including reversing which ad version looks better. Braun and Schwartz also note that platforms have little incentive to separate the effect of the ad from the effect of the audience, because their optimisation is designed to combine them.
Campbell's law, formulated for social policy, states that the more a quantitative indicator is used for decisions, the more it is exposed to pressures that distort it. Advertising has automated the pressure: bidding algorithms are trained to find the people most likely to produce an attributed conversion, which is not the same as the people most likely to be persuaded.
Why did the number move?
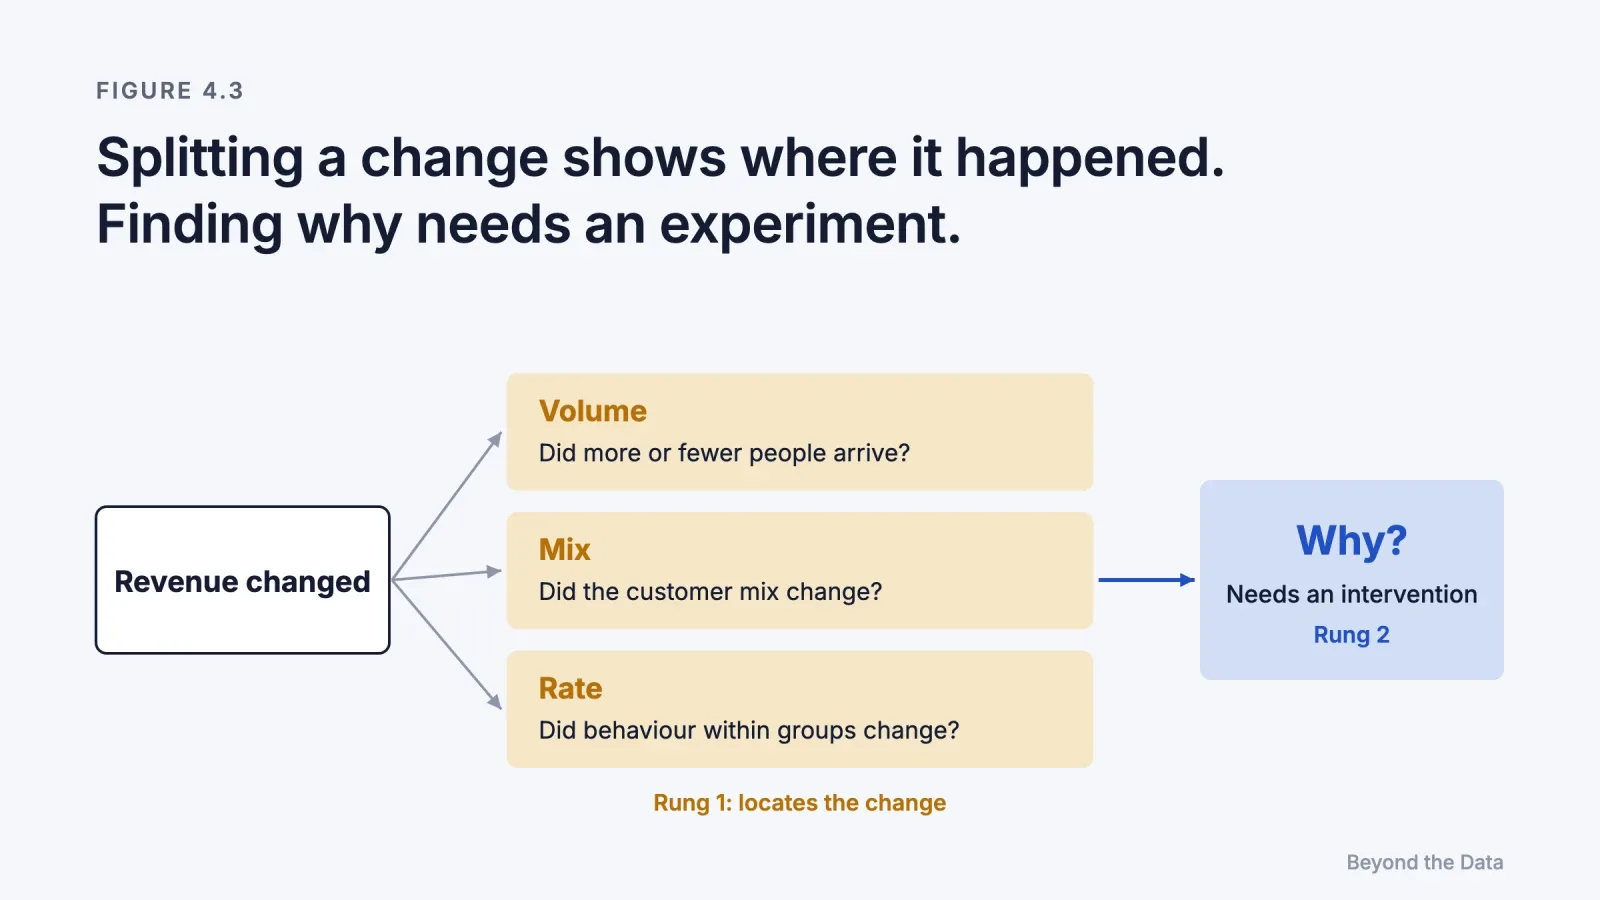
Many measurement questions in practice are not about the size of an effect but about a change: revenue fell 20% last week, or a channel's ROAS halved. Before asking whether advertising caused the change, it helps to locate it. Any change in an aggregate can be split into three parts.
| Component | Question | Example |
|---|---|---|
| Volume | Did more or fewer people arrive? | Traffic fell 15% after a holiday |
| Mix | Did the composition change? | A larger share of new customers, who convert less |
| Rate | Did behaviour within each group change? | Returning customers converted less often |
Illustrative framework.
Mix effects are the classic trap. If a campaign attracts many new visitors, the overall conversion rate can fall even though the conversion rate of every group rose. This is the pattern statisticians call Simpson's paradox (Simpson, 1951): an association that holds within every subgroup reverses when the groups are combined.
A decomposition tells you where the change happened. It does not tell you why. A drop concentrated among returning customers could be caused by an advertising change, a price change, a competitor, or a website problem. Locating a change is rung 1 of the ladder. Explaining it requires rung 2.
There is one useful bridge. When a change was planned, such as a campaign launch in some markets, time-series methods can estimate what would have happened without it by building a synthetic version of the treated market from untreated ones. Brodersen and colleagues (2015) developed a Bayesian structural time-series method for this, released as the CausalImpact package. It is still observational, but it estimates the missing outcome explicitly, which is what Chapter 5 will require.
Can better data or better models fix the problem?
[Our reading] The evidence says: not reliably. The 663-experiment study used far richer data than most advertisers have, and the best observational method still overstated lower-funnel effects nearly fivefold. More data reduces noise. It does not remove selection, because the selection is created by the same targeting that produces the data.
This does not make observational data worthless. It makes it a different kind of evidence: good for describing, ranking and spotting change, weak for sizing causal effects, and least reliable exactly where targeting is strongest, such as retargeting and brand search.
The limit of this chapter
Observational methods can locate a change and describe an association. To know what an ad caused, someone has to decide who sees it, at random, and compare. Chapter 5 describes how.
References
- Berman, R. (2018). Beyond the last touch: Attribution in online advertising. Marketing Science, 37(5), 771–792. doi:10.1287/mksc.2018.1104
- Blake, T., Nosko, C., & Tadelis, S. (2015). Consumer heterogeneity and paid search effectiveness: A large-scale field experiment. Econometrica, 83(1), 155–174. doi:10.3982/ECTA12423
- Braun, M., & Schwartz, E. M. (2025). Where A/B testing goes wrong: How divergent delivery affects what online experiments cannot (and can) tell you about how customers respond to advertising. Journal of Marketing, 89(2), 71–95. doi:10.1177/00222429241275886
- Brodersen, K. H., Gallusser, F., Koehler, J., Remy, N., & Scott, S. L. (2015). Inferring causal impact using Bayesian structural time-series models. Annals of Applied Statistics, 9(1), 247–274. doi:10.1214/14-AOAS788
- Campbell, D. T. (1979). Assessing the impact of planned social change. Evaluation and Program Planning, 2(1), 67–90. Reprinted (2011), Journal of MultiDisciplinary Evaluation, 7(15). doi:10.56645/jmde.v7i15.297
- Gordon, B. R., Zettelmeyer, F., Bhargava, N., & Chapsky, D. (2019). A comparison of approaches to advertising measurement: Evidence from big field experiments at Facebook. Marketing Science, 38(2), 193–225. doi:10.1287/mksc.2018.1135
- Gordon, B. R., Moakler, R., & Zettelmeyer, F. (2023). Close enough? A large-scale exploration of non-experimental approaches to advertising measurement. Marketing Science, 42(4), 768–793. doi:10.1287/mksc.2022.1413
- Lewis, R. A., & Rao, J. M. (2015). The unfavorable economics of measuring the returns to advertising. Quarterly Journal of Economics, 130(4), 1941–1973. doi:10.1093/qje/qjv023
- Lewis, R. A., Rao, J. M., & Reiley, D. H. (2011). Here, there, and everywhere: Correlated online behaviors can lead to overestimates of the effects of advertising. Proceedings of WWW 2011, 157–166. doi:10.1145/1963405.1963431
- Simpson, E. H. (1951). The interpretation of interaction in contingency tables. Journal of the Royal Statistical Society, Series B, 13(2), 238–241.
 Edip Ali Avcıbaşı · Co-founder & CAOCo-founder and CAO of Meerkads and Byte Digital. Has run agency operations since 2020, with a background in digital marketing, SEO and marketplaces.