
On this page 8 sections
Key findings
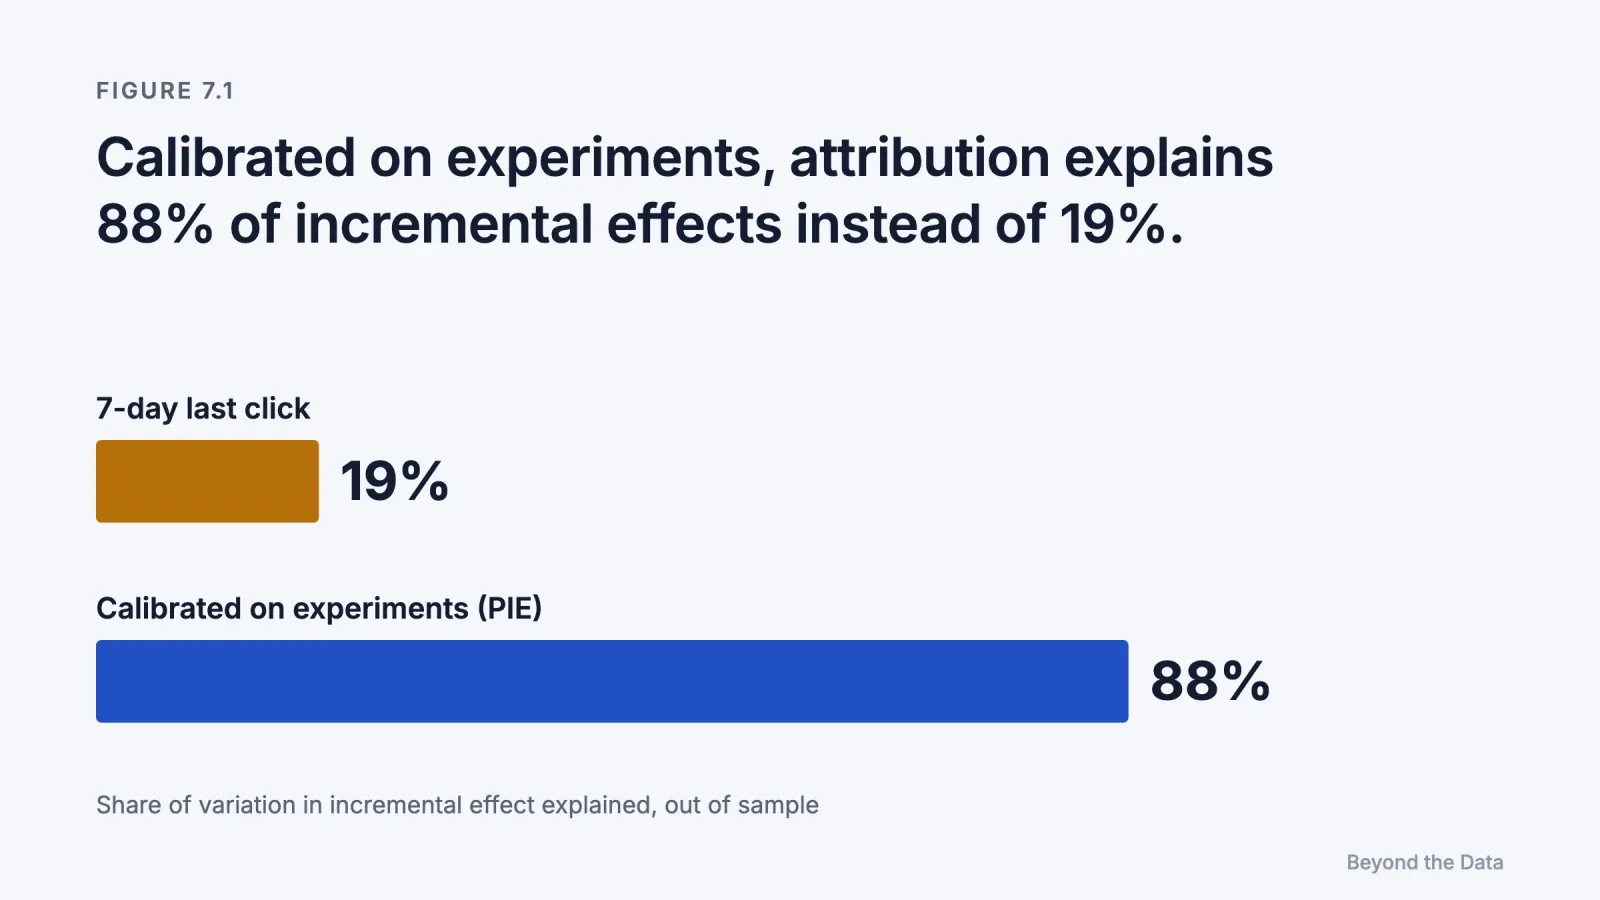
- Calibrating attribution on 2,226 experiments raised its explanatory power for incremental effects from 19% to 88% (Gordon et al., 2026). [Experiment]
- Bayesian media mix models can represent delayed and diminishing effects, but with small samples the prior assumptions largely determine the result (Jin et al., 2017). [Model]
- Google released Meridian, an open-source Bayesian media mix model, to all advertisers in January 2025 (Google, 2025). [Platform]
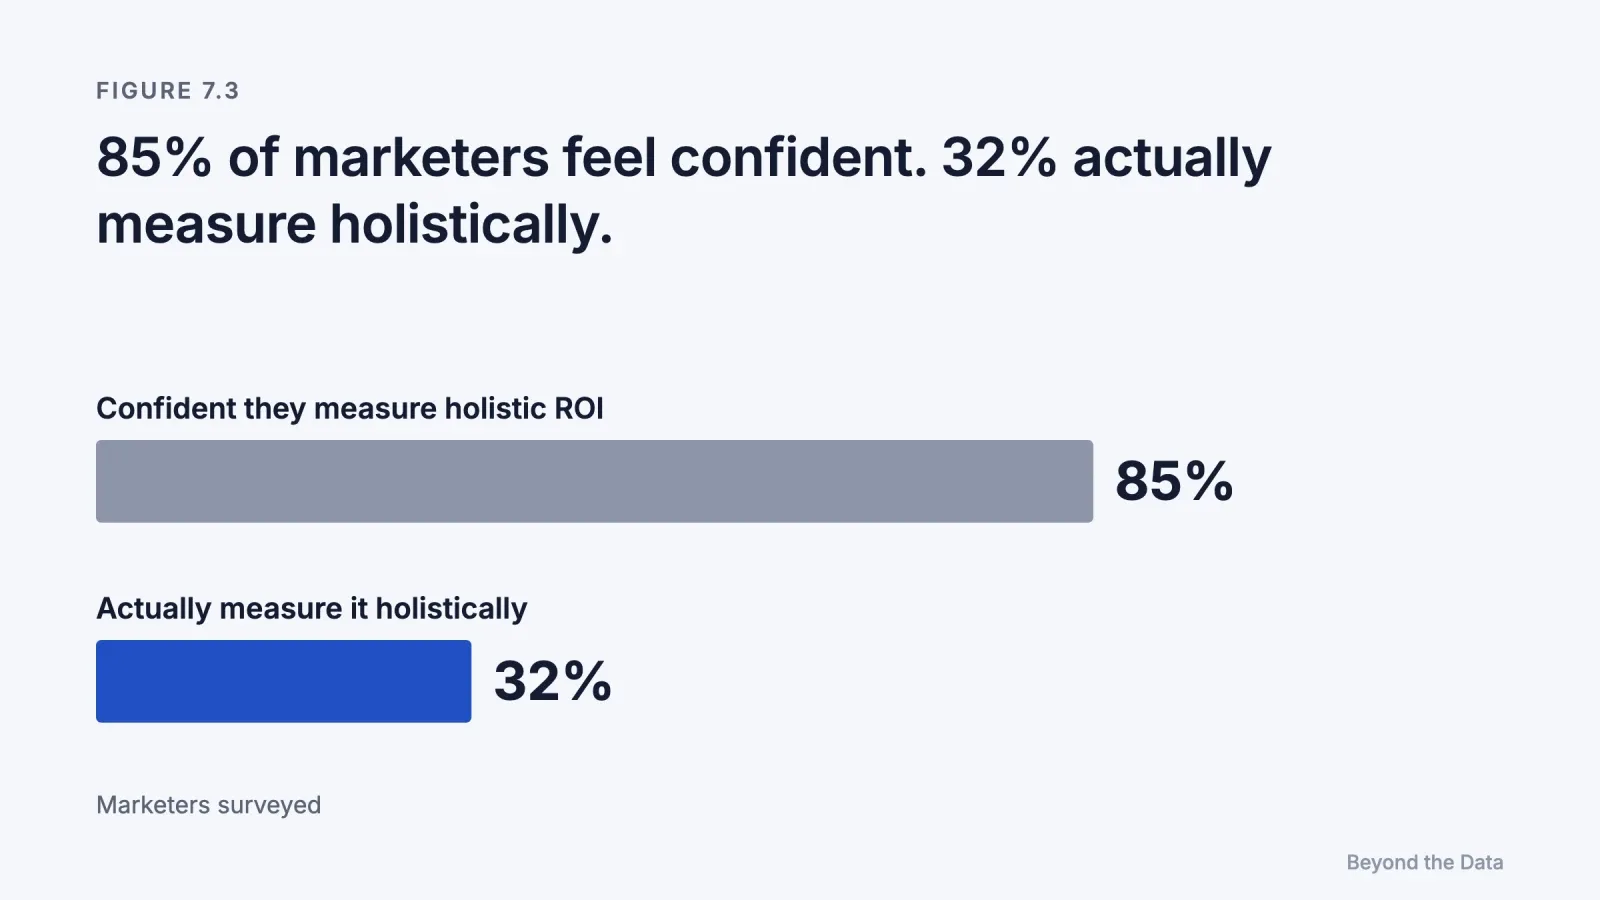
- 85% of marketers say they are confident in measuring holistic return on investment, but only 32% actually measure it holistically (Nielsen, 2025). [Industry survey]
Short answer. Each method answers a different question at a different speed. Attribution is fast and biased, so it gives daily direction within channels. Experiments are slow and local, so they give ground truth for a few channels at a time. Media mix models are broad and assumption-heavy, so they spread the evidence across all channels and budgets. Calibration ties them together: experiments correct the model and the attribution, and the model decides where the next experiment is most needed.
What is a media mix model?
A media mix model (MMM) is a statistical model that explains total sales over time with the spend in each advertising channel, plus non-advertising factors such as price, seasonality and promotions. It uses aggregate data, such as weekly sales and weekly spend by channel, so it needs no user-level tracking and is unaffected by the consent and attribution-window problems of Chapter 2.
Modern MMMs include the two features Chapter 6 showed to matter. A carryover term spreads each week's advertising effect over later weeks. A shape term makes returns diminish as spend rises. From these curves the model can compute both the average and the marginal return of each channel (Jin et al., 2017).
What are the limits of a media mix model?
They are serious, and the model's developers state them clearly.
| Limit | Why it matters | Source |
|---|---|---|
| Few data points | Two years of weekly data give about 100 observations to estimate many parameters | Jin et al. (2017); Chan & Perry (2017) |
| Prior dependence | With small samples, the Bayesian prior strongly shapes the estimates and can bias them | Jin et al. (2017) |
| Unstable optimum | In a case study, the recommended media mix varied considerably because parameters were uncertain | Jin et al. (2017) |
| Correlated spend | Channels that are usually increased together cannot be separated by the data | [Our reading] |
| Observational at heart | MMM is still a regression on non-random variation, so it inherits the selection problems of Chapter 4 | [Our reading] |
Chan and Perry (2017), also from Google, describe the difficulties MMMs face in giving consistently reliable answers about media effectiveness. The honest summary is that an MMM is a structured way of combining assumptions with data. Its value depends on how good the assumptions are and how well they are checked.
What does calibration mean?
Calibration means using experimental results to correct a non-experimental measure. It runs in two directions.
- Calibrating the model. An experiment on a channel provides a reliable estimate of its effect at current spend. That estimate is used as an informative prior or a constraint in the MMM, so the model's curve must pass near the experimental point.
- Calibrating attribution. The ratio between experimental and attributed conversions for a channel becomes a correction factor for its daily attribution numbers.
The PIE study is the strongest evidence that calibration works. Using 2,226 Meta experiments, Gordon, Moakler and Zettelmeyer (2026) built a model that predicts a campaign's incremental effect from features that are available without an experiment. Its out-of-sample R² was 0.88, against 0.19 for 7-day last click. [Experiment; one author is a Meta employee]
Platforms have moved in the same direction. Meta's incremental attribution, introduced in 2025, is a model-based estimate of caused conversions. Meta reports that it delivers 24% more incremental conversions than standard attribution, which is a platform statement about its own product (Meta, 2026). Google made Meridian, an open-source Bayesian MMM, available to everyone in January 2025 (Google, 2025), and Meta maintains an open-source MMM called Robyn.
How should the three methods work together?
| Method | Question it answers | Speed | Typical bias | Role in the system |
|---|---|---|---|---|
| Attribution | Which ads and keywords are associated with conversions within a channel? | Daily | Overstates targeted, late-funnel ads; misses untracked buyers | Direction: day-to-day optimisation within a channel |
| Experiments | What did this channel cause, at this spend, in this period? | Weeks | Local in time, budget and audience | Truth: anchor points for everything else |
| Media mix model | How do all channels, budgets and delays combine? | Monthly or quarterly | Depends on assumptions and priors | Allocation: budget across channels |
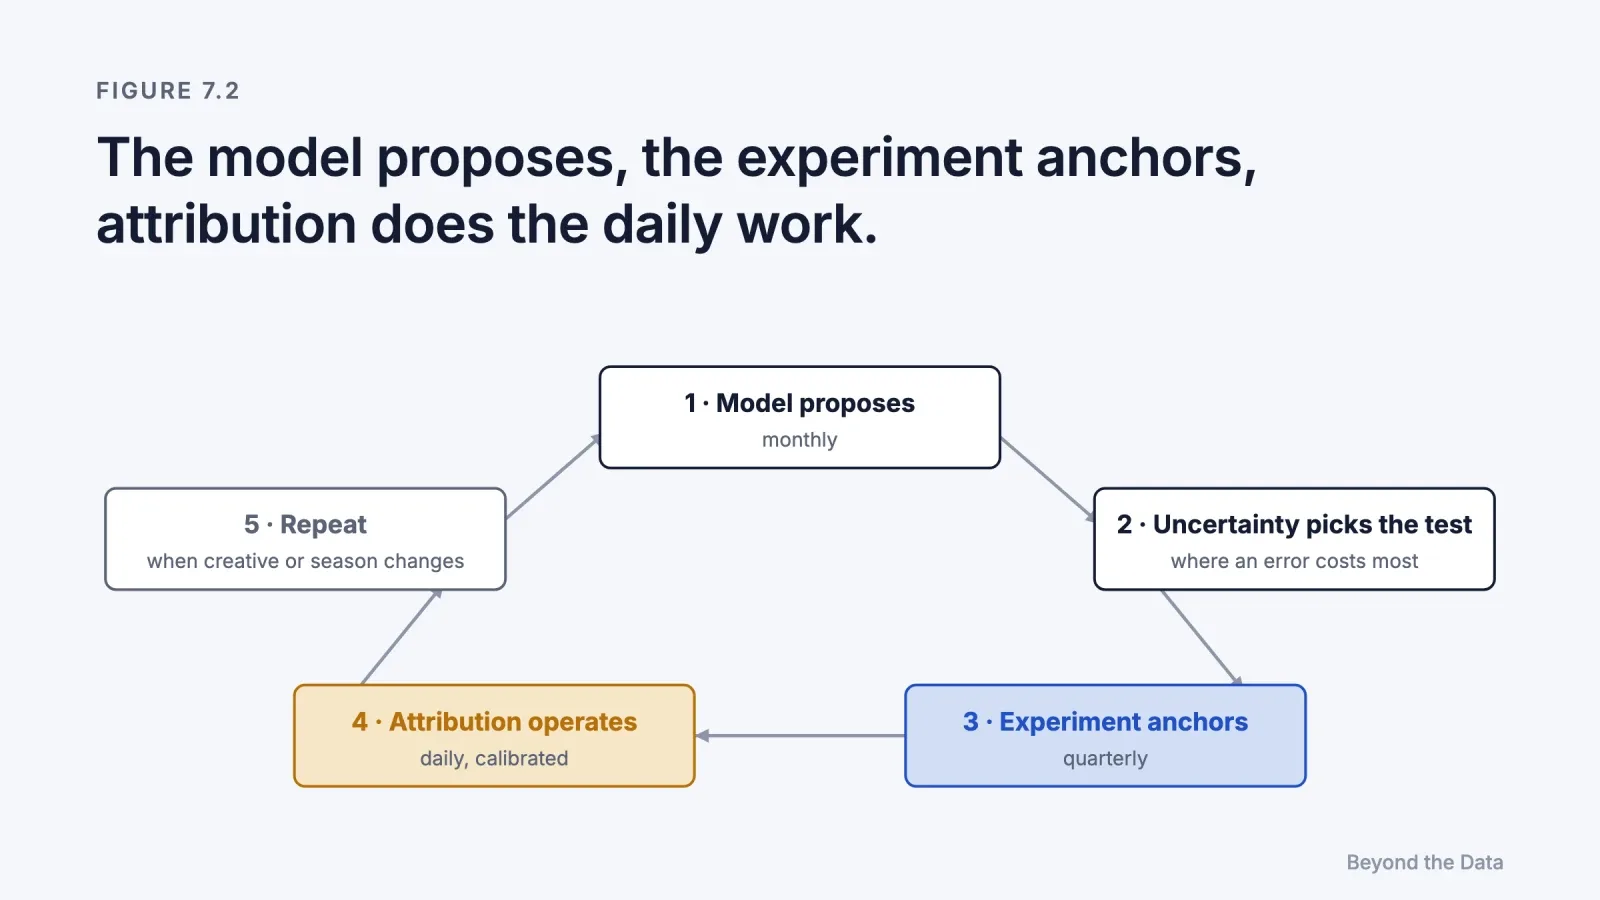
The system works as a loop. [Our reading]
- Model proposes. The MMM estimates each channel's marginal return and its uncertainty.
- Uncertainty chooses the next test. The channel whose estimate is both large and uncertain is tested first, because that is where an error costs the most.
- Experiment anchors. The result updates the MMM and produces a correction factor for that channel's attribution.
- Attribution operates. Teams optimise daily inside channels using calibrated attribution.
- Repeat. Experiments are renewed when campaigns, seasons or creative change.
What does this look like in an operating rhythm?
| Cadence | Activity | Evidence rung |
|---|---|---|
| Daily | Optimise campaigns with calibrated attribution; watch for anomalies | 1 |
| Weekly | Reconcile platform claims with store revenue (Chapter 2) | 0 |
| Monthly | Review MMM marginal returns; adjust budgets within tested ranges | 3 |
| Quarterly | Run one or two experiments where the model is least certain; recalibrate | 2 |
| Yearly | Re-estimate the MMM; review definitions and windows | 0–3 |
The Nielsen figures quoted above suggest how rare this is. Most marketers believe they measure holistically, and about a third do (Nielsen, 2025). [Industry survey]
What if a business cannot afford all three?
[Our reading] The system scales down. A small advertiser can run one geo test a quarter on its largest channel, use the result to correct attribution for that channel, and treat every uncorrected channel's attribution as an upper bound rather than an estimate. Even this minimal version moves the reporting stack from rung 1 to rung 2 for the channel that matters most.
The limit of this chapter
The system described here produces more evidence than any team can read in full: thousands of campaign rows, experiment results, model curves and corrections. Increasingly, the reader is an AI assistant asked to summarise the evidence and recommend what to do. Chapter 8 asks whether an AI analyst can tell credit from cause.
References
- Chan, D., & Perry, M. (2017). Challenges and opportunities in media mix modeling. Google Inc.
- Google. (2025, January 29). Meridian is now available to everyone. Google Blog. [Platform]
- Gordon, B. R., Moakler, R., & Zettelmeyer, F. (2026). Predicted incrementality by experimentation (PIE) for ad measurement. arXiv:2304.06828v2.
- Jin, Y., Wang, Y., Sun, Y., Chan, D., & Koehler, J. (2017). Bayesian methods for media mix modeling with carryover and shape effects. Google Inc.
- Meta. (2026, January 28). Fourth quarter 2025 earnings conference call transcript. [Platform]
- Meta. Robyn: open-source marketing mix modeling. https://github.com/facebookexperimental/Robyn
- Nielsen. (2025). 2025 Annual Marketing Report. [Industry survey]
 Edip Ali Avcıbaşı · Co-founder & CAOCo-founder and CAO of Meerkads and Byte Digital. Has run agency operations since 2020, with a background in digital marketing, SEO and marketplaces.