
On this page 8 sections
Key findings
- After Apple's App Tracking Transparency (ATT) framework, the share of trackable Apple traffic in the US fell from 73% to 22% (Kraft et al., 2023). [Observational]
- Since November 2023, Google Analytics 4 offers only data-driven and last-click attribution; first click, linear, time decay and position-based were removed (Google, 2026). [Platform]
- From 12 January 2026, Meta's Ads Insights API no longer returns 7-day and 28-day view-through windows (Meta, 2025). [Platform]
- When platforms report their own results, their totals can exceed the store's revenue, because each platform credits itself for the same sale. [Our reading, illustrated below]
Short answer. A reported conversion is a claim that a sale followed an ad within a chosen time window. The claim can be wrong in three ways: the sale is missing because it could not be tracked, the sale is counted by more than one platform, or the sale was estimated by a model rather than observed. In every case, the platform that sold the ad also decides how the ad is scored.
What is a conversion, in a platform's report?
A conversion in an advertising report is a recorded event, such as a purchase, that the platform links to a person who saw or clicked one of its ads within an attribution window. The definition has three moving parts: what counts as the event, how the link to a person is made, and how long the window is. Change any one of them and the number changes, although nothing about the customers has changed.
This chapter is about rung 0 of the evidence ladder: whether the recorded number is a faithful record at all. A perfect record would still say nothing about cause. An imperfect record makes every later step worse.
Error 1: How do sales go missing?
Sales go missing when the link between an ad and a buyer cannot be observed. The largest single change in recent years was Apple's ATT framework, introduced in 2021, which requires apps to ask permission before tracking users across other companies' apps and websites.
Kraft, Skiera and Koschella (2023) studied billions of ad impressions across eight countries. In the US, the share of Apple traffic that could still be tracked fell from 73.05% to 22.15%, a drop of about 70%. Opt-in rates ranged from 18.18% to 44.65% depending on the country. [Observational]
For a platform, a sale it cannot link to an ad does not exist in the report. Two things follow. Reported conversions fall even when real sales do not. And channels whose buyers are harder to track, such as video and mobile apps, look weaker than channels whose buyers arrive through a tracked click.

Error 2: How can one sale be counted twice?
Each platform sees only its own ads. If a customer saw an ad on Meta, clicked a Google ad later, and then bought, both platforms can claim the sale in good faith. Neither knows about the other.
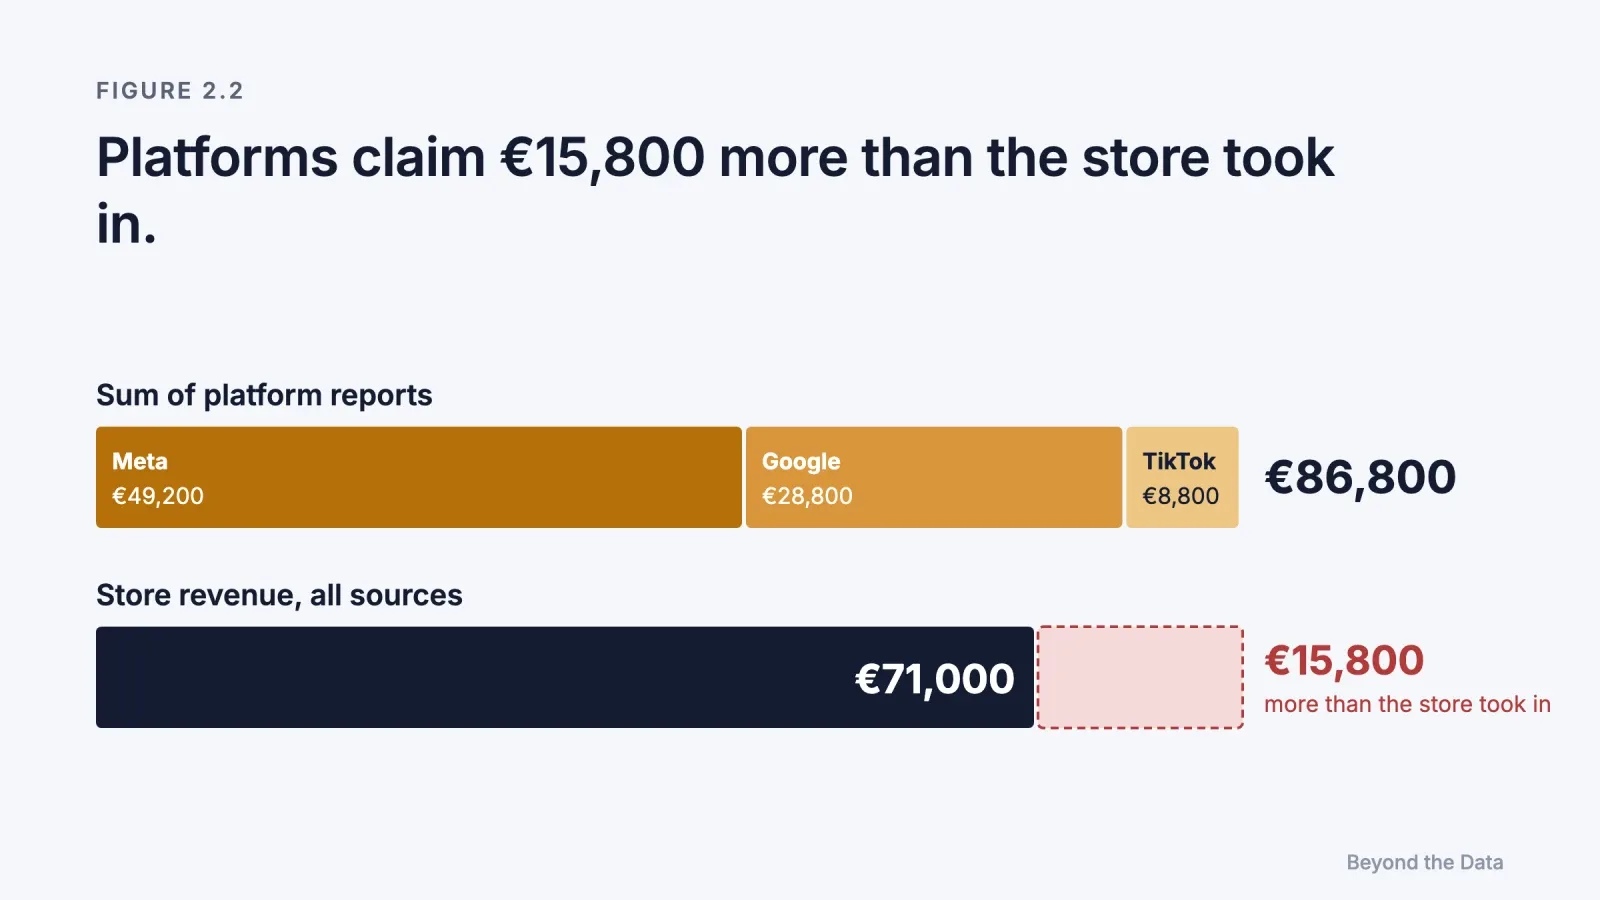
A simple check exposes this. Add up the revenue each platform reports and compare it with the revenue the store actually recorded.
| Source | Revenue reported | Note |
|---|---|---|
| Meta | €49,200 | Platform's own report |
| Google Ads | €28,800 | Platform's own report |
| TikTok | €8,800 | Platform's own report |
| Sum of platform reports | €86,800 | |
| Store revenue (all sources) | €71,000 | Includes sales no ad touched |
Illustrative example used in the test in Chapter 8.
The platforms together claim €15,800 more than the store took in, and the store figure includes organic and direct sales that no platform should claim. So the overlap is at least €15,800 and probably much larger. [Our reading] When the sum of platform claims exceeds the store's total, the individual return-on-ad-spend figures cannot be compared across platforms, because each was computed on a different and overlapping share of the same sales.
Error 3: What is a modelled conversion?
When a sale cannot be tracked, platforms increasingly estimate it. Google's data-driven attribution, the default for most conversion actions in Google Ads, assigns credit by comparing the paths of customers who converted with those who did not (Google, 2026). Meta's incremental attribution, introduced in 2025, uses a model to estimate which conversions were caused by an ad. Meta reports that it delivers 24% more incremental conversions than standard attribution (Meta, 2026). [Platform]
Modelled numbers are not wrong by nature. But they are a different kind of number. A tracked conversion records an event. A modelled conversion is an estimate of an event, made with a method the advertiser cannot inspect.
Who grades the ad?
The platform that sells the ad also measures its result. It chooses the default attribution model, the default window, the treatment of views versus clicks, and how missing data is modelled. We call this self-grading. [Our reading]
Self-grading is not a claim of bad faith. Platforms have the best data about their own ads, and some of the most rigorous studies in this book were made possible by platform data. The problem is structural: the party with the most to gain from a high number controls the definition of the number.
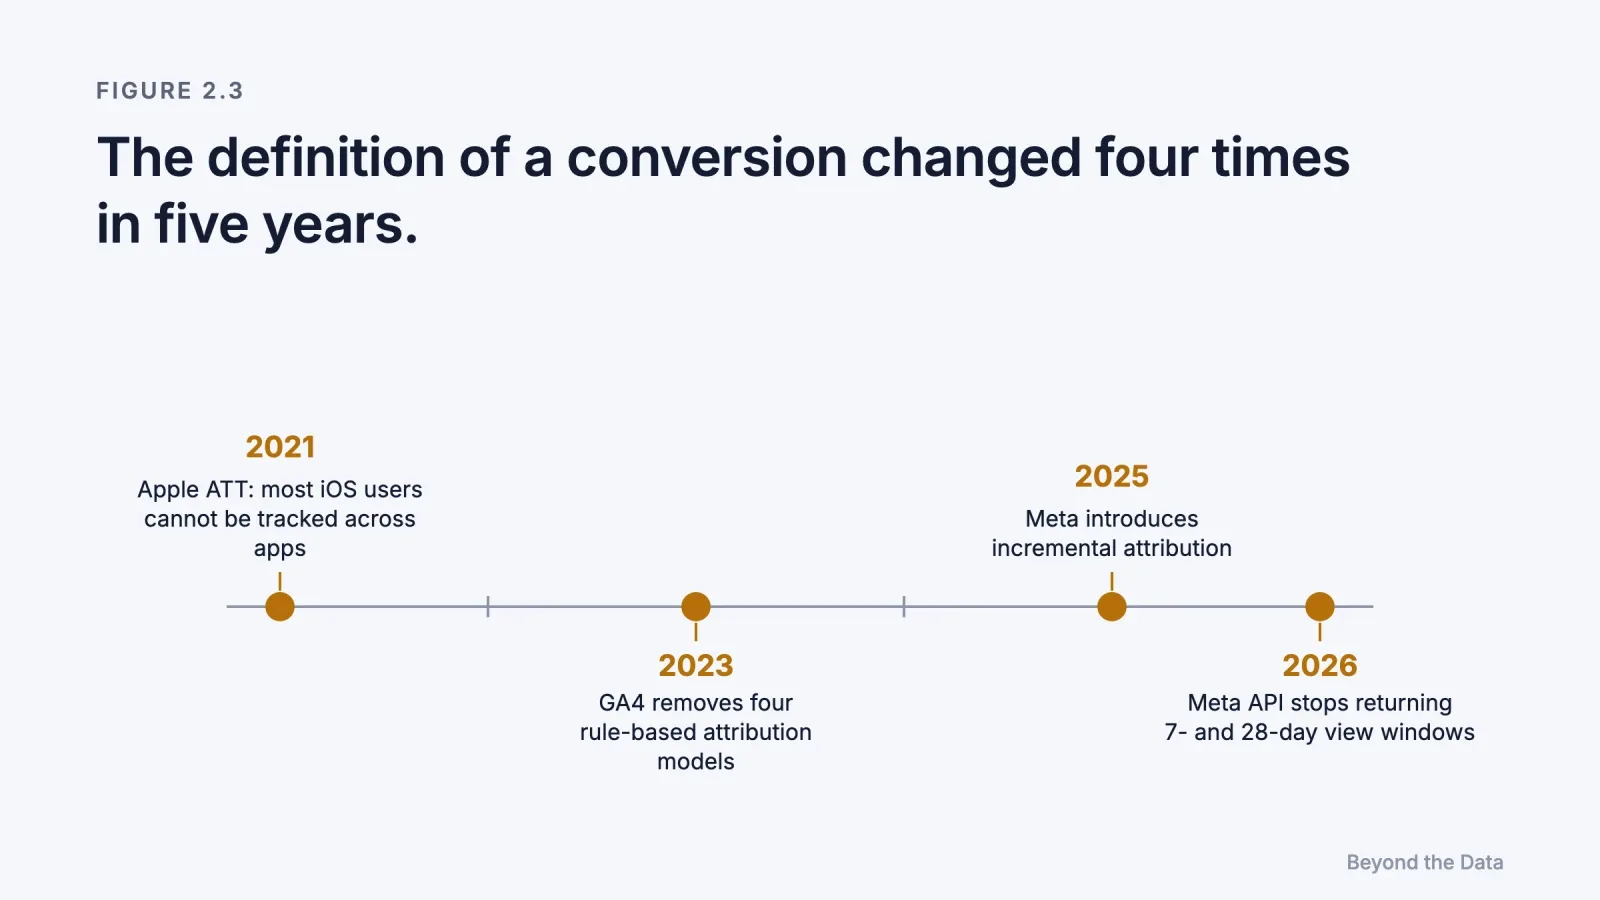
Recent changes illustrate how much the definition matters:
| Year | Change | Source |
|---|---|---|
| 2021 | Apple ATT: most iOS users not trackable across apps | Kraft et al. (2023) |
| 2023 | Google removes four rule-based models from GA4; Google Ads keeps last click and data-driven | Google (2026) |
| 2025 | Meta introduces incremental attribution | Meta (2026) |
| 2026 | Meta API stops returning 7-day and 28-day view windows | Meta (2025) |
Each change altered reported conversions for the same advertising. Advertisers who compare this year's numbers with last year's are often comparing two different definitions.
There is also a deeper incentive problem. Berman (2018) shows with a game-theoretic model that last-touch attribution encourages publishers to over-supply impressions and often lowers advertisers' profit. The scoring rule does not just describe the outcome. It shapes behaviour, including the behaviour of bidding algorithms that are trained on the rule's output. [Model]
What should an advertiser check first?
- Reconcile to the store. Every month, compare the sum of platform-reported revenue with store revenue from all sources. If the sum is close to or above the store total, treat platform ROAS as credit, not as cause.
- Freeze the definitions. Record the attribution model, window and view settings used for each report. A trend is only meaningful if the definition did not change underneath it.
- Separate observed from modelled. Where the platform reports modelled conversions, note them separately from tracked ones.
- Name the grader. For each number in a report, note who produced it. A number produced by the seller of the ad is a platform statement, not independent evidence.
The limit of this chapter
Suppose every sale were recorded once, correctly, and linked to every ad the buyer saw. The record would still show only which ads appeared before which sales. It would not show which sales the ads caused. Turning that record into credit is the job of attribution models, and Chapter 3 asks what those models can and cannot tell us.
References
- Berman, R. (2018). Beyond the last touch: Attribution in online advertising. Marketing Science, 37(5), 771–792. doi:10.1287/mksc.2018.1104
- Google. (2026). About attribution models; About data-driven attribution (Google Ads Help 6259715, 6394265); Attribution models in Google Analytics (Analytics Help 10596866). Accessed 13 November 2026.
- Kraft, L., Skiera, B., & Koschella, T. (2023). Economic impact of Apple's App Tracking Transparency framework. Proceedings of the European Marketing Academy (EMAC).
- Meta. (2025, October 16). Ads Insights API metric availability updates. Meta for Developers Blog.
- Meta. (2026, January 28). Fourth quarter 2025 earnings conference call transcript. [Platform; company statement about its own product]
 Edip Ali Avcıbaşı · Co-founder & CAOCo-founder and CAO of Meerkads and Byte Digital. Has run agency operations since 2020, with a background in digital marketing, SEO and marketplaces.