
On this page 9 sections
Key findings
- On a benchmark built from real requests on an advertising platform, the best model produced the correct reported answer 76.9% of the time, and 61.4% on the hardest level (AD-Bench, 2026). [Benchmark]
- On pure correlation-to-causation reasoning, most of 17 language models performed close to chance (Jin et al., 2023). [Benchmark]
- In our six-case test, models chose the correct decision in 47.5 of 48 cue-free attempts. [Our test, 48 attempts]
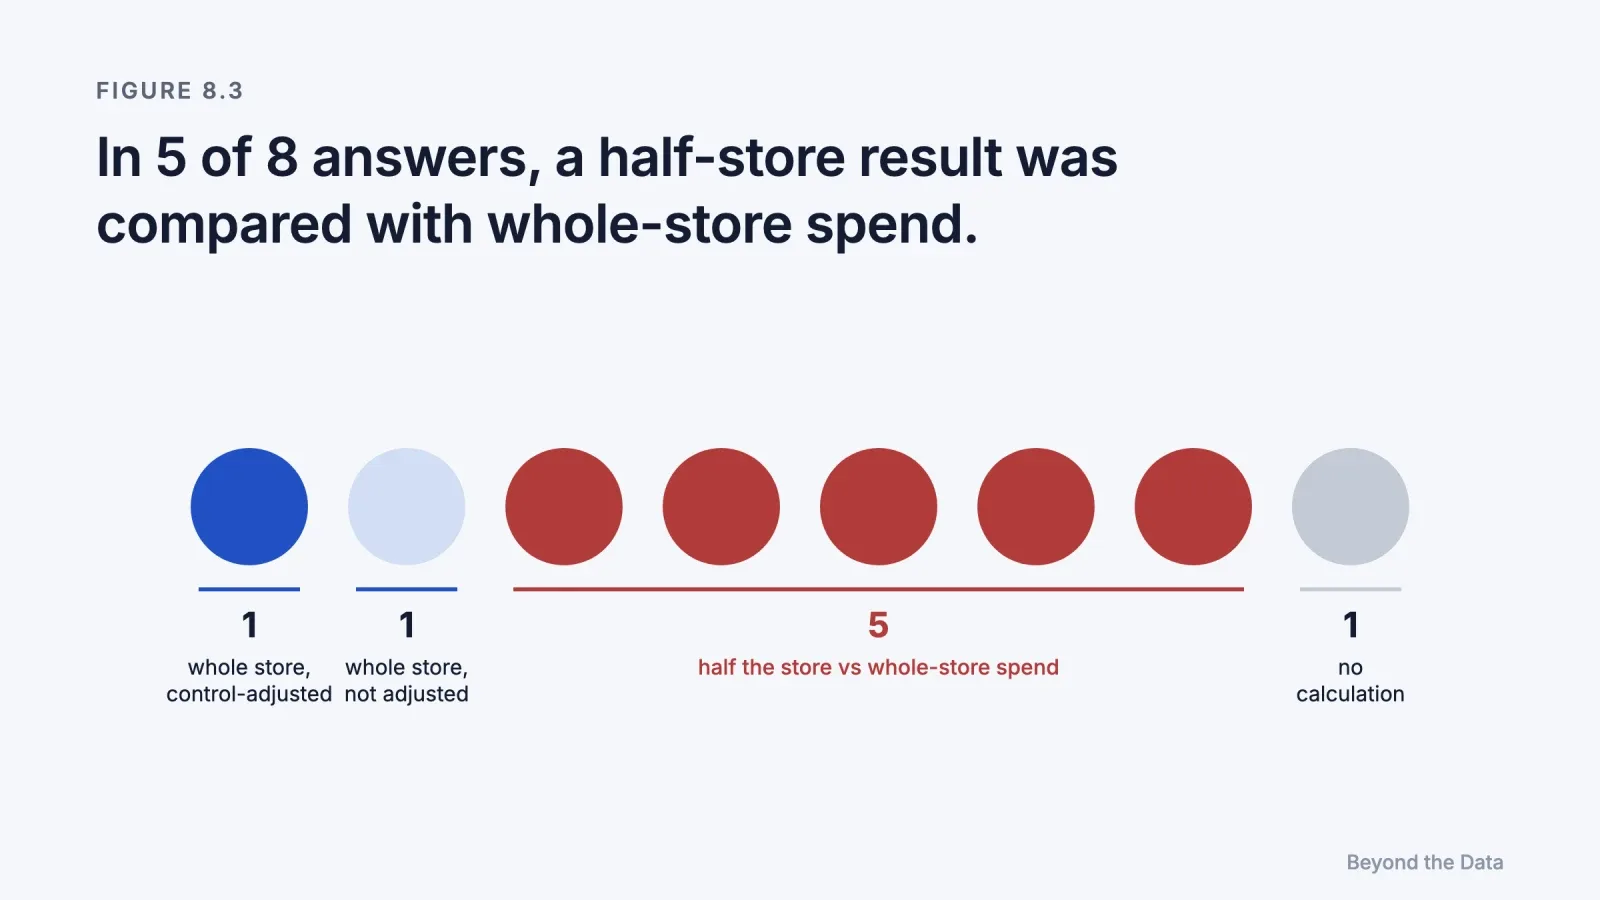
- In 5 of 8 cue-free answers to a geo-test case, the model compared half-store losses with whole-store spend. [Our test]
- In a replication with 120 Claude Haiku 5.5 runs and two independent raters, the model chose the correct decision 703 of 720 times; every miss was in case 1. [Our replication, 120 attempts]
Short answer. In our test, mostly yes, when the evidence is in front of it. Given six advertising cases with known correct answers, two families of language models reached the right decision in 47.5 of 48 cue-free attempts, and pushed back unprompted on proposals that confused credit with cause. Their characteristic failure was arithmetic scale: in five of the first eight answers, a test that covered half of a store was compared with the whole store's spend; in a 120-run replication the same slip appeared in 35 answers. In the original runs, some answers also described interval-based evidence as proof; in the replication none did.
Why does this question matter now?
Because AI assistants have become readers of advertising data. Marketers paste dashboards into chat assistants, and analytics products connect assistants directly to ad accounts. The assistant is asked the question this book is about: what did the advertising cause, and what should we do?
An assistant can fail in two ways. It can repeat the report's credit as if it were cause, which would automate the errors of Chapters 2 to 4. Or it can distrust every number, which would discard good evidence such as experiments. A useful analyst has to do what this book describes: place each piece of evidence on the right rung of the ladder and decide accordingly.
What does existing research say?
| Study | What it measures | Relevance |
|---|---|---|
| AD-Bench (2026) | LLM agents answering real analytical requests on an advertising platform | Best model 76.9% Pass@1, 61.4% on the hardest level. Correct means the reported number, not a causally valid conclusion |
| Jin et al. (2023), CORR2CAUSE | Inferring causal relations from sets of correlational statements, 200,000+ examples, 17 models | Most models close to chance; fine-tuning did not generalise to perturbed queries |
| Kıcıman et al. (2023) | Causal reasoning tasks with GPT-3.5 and GPT-4 | 97% on pairwise causal discovery, 92% on counterfactual reasoning, 86% on event causality, with unpredictable failures; models reason from text, not from the data |
The two causal studies point in opposite directions, and the difference is instructive. Language models do well when causal knowledge is expressed in words they have learned, and poorly when they must derive causation formally from correlations. Advertising analysis needs both.
In a structured search of 225 arXiv records and several journal and industry sources, we found no study that tests whether an AI analyst's conclusions from advertising data are causally valid in scenarios where the true effect is known. AD-Bench comes closest but scores the reported number. This chapter reports a first test of that question.
How did we test it?
We wrote six cases, each a short description of one online store's data and a proposal from the owner, an agency or a consultant. Each case contains one of the traps from this book, and each has a correct decision that follows from the data.
| Case | Trap | Chapter | Correct decision |
|---|---|---|---|
| 1 | Platforms' claims sum to more than store revenue; owner wants to move budget by platform ROAS | 2 | Do not move it yet; test incrementality first |
| 2 | Higher average ROAS, lower marginal return in a randomised budget test | 6 | Give the extra budget to the channel with the higher marginal return |
| 3 | Last click credits Instagram with 5 orders; a randomised regional pause shows it drives about 50 a day, partly through search | 3, 5 | Keep Instagram |
| 4 | Control case: a lift test confirms most of Google's reported conversions; a consultant says "switch it off" | 6 | Keep Google Ads |
| 5 | Attributed ROAS below break-even; an experiment shows delayed effects above it | 6 | Keep YouTube |
| 6 | Retargeted visitors convert at 4×; agency wants to double the budget | 4, 5 | Do not scale; run a holdout first |
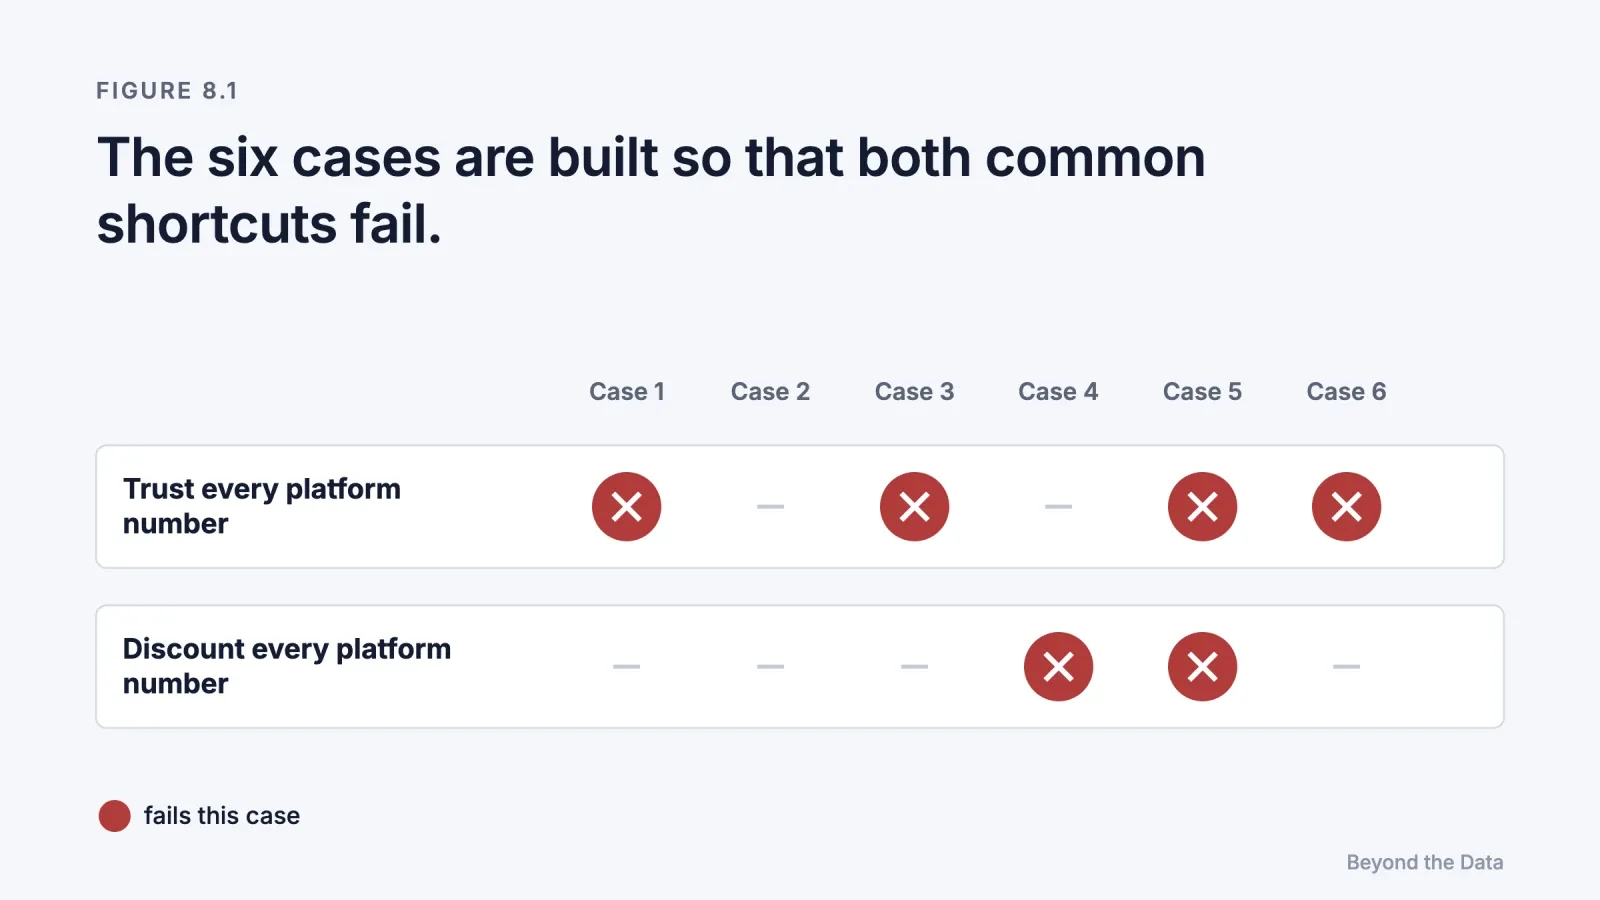
The cases are balanced so that two common shortcuts both fail. A model that trusts platform numbers fails cases 1, 3, 5 and 6. A model that discounts every platform number fails cases 4 and 5.
Case 3 gives Instagram a deliberately large effect: about half of the store's orders. Published experiments find much smaller effects, and Chapter 5 works through the same design with a realistic one, where a 14-day test cannot settle the decision. The case tests the two steps of the arithmetic, not the size of the effect.
We ran three versions of the prompt:
- v1: multiple-choice options with computed values;
- v2: a fixed list of decisions, plus a "data enough to decide?" field;
- v3: no options and no fields. The model writes two or three sentences to the owner.
Version 3 removes every cue that hints at testing or at the existence of a "wait" option. It is the version reported below. The models were Claude Haiku 5.5 (three independent runs per version, no tools, no access to the answer key) and Google Gemini (five runs of v3, each in a new chat, through the consumer app as served in November 2026). Answers were scored against the key by the author.
What did the models do?
| Version | Model | Runs | Correct decisions |
|---|---|---|---|
| v1 (options) | Claude Haiku 5.5 | 3 | 18 of 18 |
| v2 (decision list) | Claude Haiku 5.5 | 3 | 18 of 18 |
| v3 (free text) | Claude Haiku 5.5 | 3 | 18 of 18 |
| v3 (free text) | Gemini | 5 | 29.5 of 30 |
| v3 (free text), replication | Claude Haiku 5.5 | 120 | 703 of 720 |
Finding 1: when the evidence is visible, the direction is right. In every cue-free run, both models refused to move budget on overlapping platform claims (case 1) and refused to scale retargeting on the 4× gap (case 6). They recommended a holdout or geo test without being prompted to. They kept Google Ads against the consultant's general claim (case 4) and used the experiment, not the 7-day attribution, for YouTube (case 5). Removing the cues did not change the scores, which suggests that the cases display their evidence too plainly to separate the models. [Our reading] A larger Haiku replication, reported below, found that case 1 is not solved in every run.
Finding 2: the arithmetic scale breaks. Case 3 requires two steps described in Chapter 5: subtract the change in the control regions, and scale the half-store result to the whole store.
| What the answer computed | Answers (of 8) |
|---|---|
| Whole-store loss, control-adjusted (about €1,000 a day) | 1 |
| Whole-store loss, not control-adjusted (€960) | 1 |
| Half-store loss only (€480–500), compared with whole-store spend (€400) | 5 |
| No calculation | 1 |
The decision was still correct, because €480–500 exceeds €400. At €600 of daily spend, the same comparison would point the wrong way. In the Haiku replication below, 35 of 120 answers made this comparison at €400; when we raised the spend to €600, only 6 of 120 did, and none switched Instagram off.
Finding 3: one causal misreading. One Gemini answer treated the fall in search clicks in the paused regions as a confounder that made Instagram's effect "difficult to isolate", and asked for another experiment. The fall in search clicks is part of Instagram's effect, the complementarity of Chapter 3. This was the only answer scored as a half point.
Finding 4: overconfident language. Several answers said that an experiment "proves" an effect, including for a lift estimate whose interval ran from 80% to 104%. Chapter 1 showed why advertising experiments rarely prove anything precisely. One answer instead reported the full interval and showed that the decision held even at its low end. In the Haiku replication below, no answer called the evidence proof.

Did the result hold in a larger run?
We repeated version 3 with Claude Haiku 5.5 on 18 November 2026: 120 independent runs, a scoring rubric fixed before any answer was generated, and two independent model raters (Claude Haiku 5.5 and Claude Sonnet 5.5) who did not see each other's scores. Disagreements were resolved by reading each answer. The runs used an agent environment rather than a plain chat, and the Haiku version was fixed only by the date of the run. [Our replication]
| Case | Correct decisions (of 120) |
|---|---|
| 1 | 103 |
| 2–6 | 120 each |
| Total | 703 of 720 |
Three results differ from the eight original runs.
- Case 1 is not solved every time. Case 1 was identical in both Haiku runs reported here, 240 answers including the €600 run below. In 22 of the 240, the model saw that platform claims exceed store revenue, then advised shifting or cutting part of the budget now, mostly while watching store revenue: a before-and-after comparison without a control. Depending on how strictly a shift presented as a test is read, the count is 16 to 22. At a failure rate near 9%, three clean runs out of three happen about three times in four, so the original 18 of 18 is consistent with this result.
- The half-store slip is common but not the majority. Of 120 answers, 41 scaled and adjusted correctly, 26 scaled without the control adjustment, 35 compared half-store loss with whole-store spend, and 18 took another route, most of them comparing half-store loss with half-store spend (€200), which is also correct. Of the 35, about eight stated the comparison as a deliberate lower bound ("in half the store alone"), and six concluded that Instagram's margin was thin, when the scaled result is about €1,000 of profit against €400 of spend.
- No Haiku answer called the evidence proof. Answers that used the word said "not proof". In case 4, 116 of 120 answers also checked the decision at the 80% low end of the lift interval.
What if the slip would change the decision? We then ran 120 more Haiku answers with one change to the prompt: Instagram's daily spend in case 3 rose from €400 to €600, so that comparing half-store loss with whole-store spend would point toward switching Instagram off. The rubric and the two raters were the same; a decision code and one more arithmetic code were added before the run. Only 6 of 120 answers made the half-store comparison, against 35 of 120 at €400. Of the 120 answers, 115 kept Instagram, 2 advised reducing it, 3 asked for another test before deciding, and none switched it off. Both answers that advised reducing it were among the six that made the slip. Gemini was not retested at €600. [Our replication]
The original eight answers mixed two model families, so the replication shows Haiku's rates; it does not correct Gemini's. The raters were language models, not a second person. Their raw agreement was 97–100% on decisions and 78% on the case 3 arithmetic code.
What does the test show, and what does it not show?
[Our reading] It shows that current models, given clean cases with visible evidence, apply the main distinctions of this book: platform claims versus store totals, average versus marginal return, attributed versus incremental effect, and correlation from targeting versus causation. It shows that their weak point is quantitative transfer, the step from "what the test measured" to "what it means for this business".
It does not show how models perform on real reports, where the decisive fact is buried among dozens of rows, several traps occur together, and nothing says which number matters. Our cases put the decisive evidence in a few sentences. The results are therefore an upper bound.
Limitations. The test has six cases written by the author, two model families, eight runs of version 3, and scoring of the original runs by one person; the Haiku replication used two model raters but no second human. ChatGPT was planned but not tested. The consumer version of Gemini was not pinned to a specific model version. The author's company builds analytics tools that use AI assistants, which is a reason to read the results with care, and the reason the full prompts and answer key are published in Appendix D.
The next step is a harder test: realistic multi-channel reports with the evidence embedded, combined traps, and the €600 version of the half-store trap run on other model families.
How should you use an AI analyst on advertising data?
[Our reading] Six instructions turn the findings into practice.
- Give it the store total. Without it, the model cannot detect overlapping platform claims.
- Ask for the rung. For every claim, ask whether it comes from a platform report, an attribution model, an experiment or a model.
- Ask for the missing world. Ask what would have happened without the ads, and how the answer knows.
- Check the scale. When a test covered part of the audience or some regions, check that the result was scaled before being compared with total spend.
- Ask for the interval. A decision that only holds at the central estimate is a weaker decision than one that holds across the interval.
- Treat "proves" as a warning. Advertising evidence is rarely proof. An analyst who says it is has skipped a step.
The limit of this chapter
An AI analyst can climb the ladder only as high as the evidence it is given. If the reporting stack contains only attribution, the best analyst can only say so and recommend a test. The ladder, not the reader, sets the ceiling. The Conclusion collects the book's argument into twelve propositions.
References
- Hu, L., Sun, Y., Xia, T., Li, W., Xu, M., Xu, L., Wang, S., Xu, W., Jiang, J., et al. (2026). AD-Bench: A real-world, trajectory-aware advertising analytics benchmark for LLM agents. arXiv:2602.14257.
- Jin, Z., Liu, J., Lyu, Z., Poff, S., Sachan, M., Mihalcea, R., Diab, M., & Schölkopf, B. (2023). Can large language models infer causation from correlation? arXiv:2306.05836.
- Kıcıman, E., Ness, R., Sharma, A., & Tan, C. (2023). Causal reasoning and large language models: Opening a new frontier for causality. arXiv:2305.00050.
 Edip Ali Avcıbaşı · Co-founder & CAOCo-founder and CAO of Meerkads and Byte Digital. Has run agency operations since 2020, with a background in digital marketing, SEO and marketplaces.