
On this page 7 sections
Abstract
Every advertising report hands out credit. A platform says its ads drove 300 purchases, an attribution model says Search earned 75% of last month's orders, and a dashboard ranks channels by return on ad spend. None of these numbers says what the advertising caused, meaning how many sales would have disappeared if the ads had not run. This book is about the distance between those two quantities.
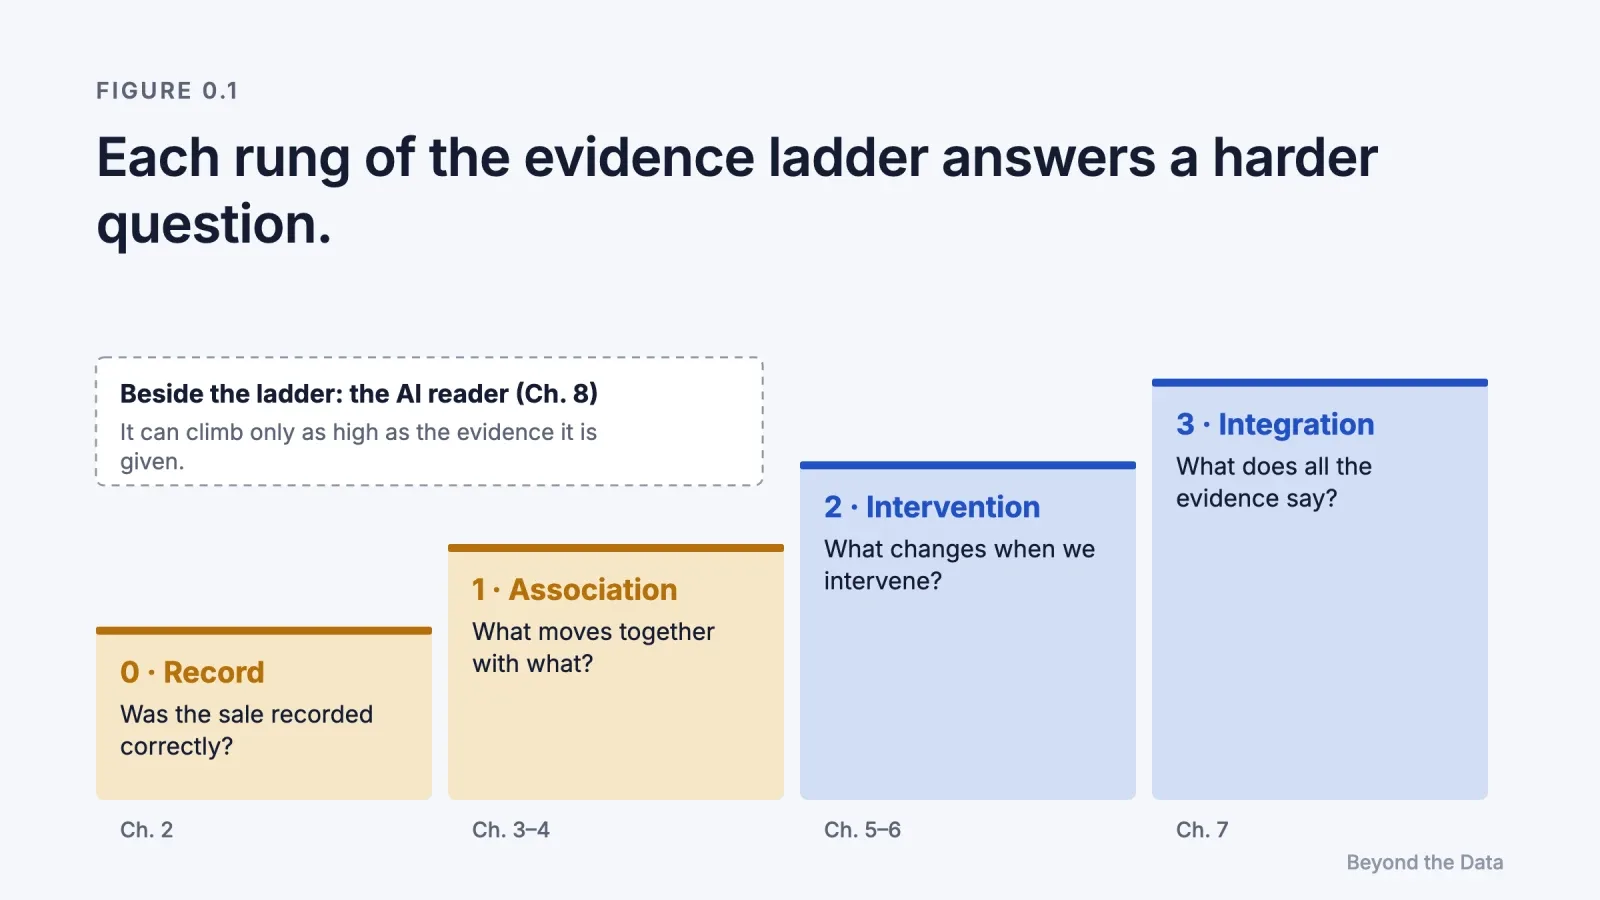
The book assembles the evidence on that distance into one framework, the evidence ladder. Each rung answers a harder question. Rung 0 asks whether a sale was recorded correctly. Rung 1 asks what moves together with what. Rung 2 asks what changes when we intervene. Rung 3 asks what all of the evidence says when it is read together. Attribution models, platform reports and dashboards live on the lower rungs. Experiments live on rung 2. Media mix models and calibrated systems try to reach rung 3.
The evidence comes from controlled experiments run on the largest advertising platforms, from meta-analyses that cover thousands of campaigns, and from the platforms' own documentation. Three findings recur. Advertising effects are real but small relative to the noise in sales. Observational methods tend to overstate them, sometimes by a factor of ten or more. And the credit that attribution assigns behaves by rules that have no causal meaning: when channels reinforce each other, their separate causal effects add up to more than 100% of the sales they jointly produce, so there is no single natural division of credit; a causal split exists only under stated assumptions about how interactions are shared.
The final chapter adds an original test. Because many marketers now ask AI assistants to read their advertising data, we gave six measurement traps to two families of language models. With the evidence visible, both reached the right decision in almost every case. Their characteristic slip was a different one: when a test covered half of a store, some answers compared the half-store loss with whole-store spend (35 of 120 in a replication). When the slip would have changed the decision, it fell to 6 of 120, and no answer switched the channel off.
The book ends with twelve numbered propositions, each tied to a chapter and its sources.
How to read this book
The book is written to be read in three layers.
- Skim layer (5 minutes). Read the twelve propositions at the end. Each one stands on its own.
- Decision layer (30 minutes). Every chapter opens with its question, a short answer of about fifty words, and a box of key findings. Reading only those gives the full argument.
- Evidence layer (about 80 minutes). The body of each chapter shows the studies, their designs and their numbers, and closes with the limit that leads to the next chapter.
Every factual claim carries an evidence label:
| Label | Meaning |
|---|---|
| [Experiment] | Randomised controlled trial or field experiment |
| [Observational] | Estimated from data without random assignment |
| [Model] | Output of a statistical or simulation model |
| [Platform] | Statement by an advertising platform about its own product |
| [Experiment vs observational] | A study that compares an experiment's result with observational estimates for the same campaigns |
| [Analytical] | A result derived mathematically rather than from data |
| [Methodological review] | A review of when a method can be trusted |
| [Textbook principle] | An established principle in a field's textbooks |
| [Industry survey] | A survey of marketers or companies; it shows what is done, not what works |
| [Benchmark] | Language models' score on a standard set of tasks |
| [Our test] | The test run for this book (Chapter 8, Appendix D) |
| [Our reading] | Our inference from the sources, not a finding of any study |
The evidence ladder
| Rung | Question | Typical methods | Chapters |
|---|---|---|---|
| 0 · Record | Was the sale recorded correctly? | Tracking, attribution windows, consent, modelled conversions | 2 |
| 1 · Association | What appears together with what? | Attribution models, dashboards, before-and-after comparisons | 3, 4 |
| 2 · Intervention | What changes when we change something? | Holdouts, ghost ads, geo experiments, synthetic controls | 5, 6 |
| 3 · Integration | What does all the evidence say together? | Media mix models, calibration, triangulation | 7 |
| Beside the ladder · Reader | Which rung can an AI analyst reach? | Language models reading reports | 8 |
Chapter 1 explains why the ladder is needed at all: the effect of advertising is a difference between two worlds, and only one of them can be observed.
The ladder borrows its shape from two older ideas, Judea Pearl's ladder of causation (association, intervention, counterfactuals) and the hierarchy of evidence used in medicine. It is not identical to either. Rung 0 has no counterpart in Pearl's ladder because advertising data, unlike most scientific data, is recorded by an interested party. The ladder orders the scope of the question, not the strength of the evidence: a method on a higher rung asks a broader question, but its answer is not always more reliable.
Chapter map
| # | Question | Short answer |
|---|---|---|
| 1 | Why is the effect of advertising so hard to see? | The effect is the gap between sales with and without the ads. It is small, sales are noisy, and ads go to people who were likely to buy anyway. |
| 2 | What does a reported conversion actually record? | A recorded conversion can be missing, counted twice, or modelled. The platform that sold the ad also grades it. |
| 3 | What can an attribution model tell you, and what can't it? | Attribution divides credit by a rule. When channels reinforce each other, their causal effects add up to more than 100%, so there is no single natural split. |
| 4 | Why do observational ad measurements overstate effects? | Targeting and user activity make exposed people different from unexposed ones. Across hundreds of experiments, observational methods miss the experimental answer by large margins. |
| 5 | How do you measure what an ad caused? | Randomise who can see the ad, then compare. Holdouts, ghost ads and geo experiments are the main designs, each with a cost and a blind spot. |
| 6 | How should budget follow evidence? | Follow the marginal return, not the average. Saturation, delay and synergy all move the margin away from what reports show. |
| 7 | How do attribution, experiments and models fit together? | Attribution gives daily direction, experiments give ground truth, models spread it across channels. Calibration connects them. |
| 8 | Can an AI analyst tell credit from cause? | In our test, yes when the evidence is visible. The typical slip was arithmetic scale, not causal confusion. |
Original contributions
- The evidence ladder. It orders measurement methods into four rungs by the question they ask; the record rung has no counterpart in Pearl's ladder. (This page)
- Totals above 100%. It carries the epidemiological principle that attributable fractions can sum to more than 100% (Rothman) over to attribution. (Chapter 3)
- The self-grading platform. It treats a platform measuring the ads it sold as a distinct type of error. (Chapter 2)
- A triangulation routine. It combines attribution, experiments and media mix models into one operating routine through calibration. (Chapter 7)
- An AI analyst test. It tests whether language models can tell credit from cause, using cases with known answers. (Chapter 8, Appendix D)
- Evidence labels and twelve propositions. Every claim shows the kind of evidence behind it, and the argument is gathered into twelve propositions, each tied to a chapter. (Conclusion)
What this book does not measure
The evidence in this book comes mostly from online advertising and from experiments that last days or weeks. It measures what advertising adds to sales within that window. Four things fall outside it.
- Long-term brand effects. Advertising can build memory, preference and pricing power over months or years. Short tests do not see this. The meta-analysis in Chapter 1 found long-run elasticities about twice the short-run ones, so a test that ends early tends to understate the total effect.
- Reach beyond the targeted audience. User-level experiments run inside the audience a platform has already chosen. The value of reaching people who are not yet thinking of buying lies largely outside their view.
- Creative. An experiment says what one ad did in one period. It does not say why that ad worked or what a better ad would have done.
- What has not been tested. A missing experiment is missing evidence. It is not evidence that a channel does nothing.
[Our reading] When a channel's purpose is long-term, keep the paused regions under observation for several weeks after the test ends, and read the test result as likely to understate the total effect.
Conflict of interest
The author is a co-founder of Meerkads, a company that builds advertising analytics software, including tools that let AI assistants read advertising data. The book does not describe or recommend any Meerkads product. The Practical guides page at the end of the book links, chapter by chapter, to practical guides on the Meerkads blog; the chapters themselves carry no such links. Several sources are written by employees of advertising platforms or use platform data; each such case is noted where it is cited, because access to experimental advertising data is in practice only possible from inside a platform.
Contents
- Preface
- Chapter 1Why is the effect of advertising so hard to see?
- Chapter 2What does a reported conversion actually record?
- Chapter 3What can an attribution model tell you, and what can't it?
- Chapter 4Why do observational ad measurements overstate effects?
- Chapter 5How do you measure what an ad caused?
- Chapter 6How should budget follow evidence?
- Chapter 7How do attribution, experiments and models fit together?
- Chapter 8Can an AI analyst tell credit from cause?
- ConclusionTwelve propositions
- Appendices
- Practical guides
 Edip Ali Avcıbaşı · Co-founder & CAOCo-founder and CAO of Meerkads and Byte Digital. Has run agency operations since 2020, with a background in digital marketing, SEO and marketplaces.