
On this page 9 sections
- What is an attribution model?
- How do data-driven models work?
- Why do causal effects add up to more than 100%?
- Is there real evidence that channels reinforce each other?
- Can the sum also fall below 100%?
- How well does attribution predict what an experiment would find?
- What is attribution good for, then?
- The limit of this chapter
- References
Key findings
- Display advertising raises searches for the advertised brand by 30–45% (Lewis & Nguyen, 2015). [Experiment]
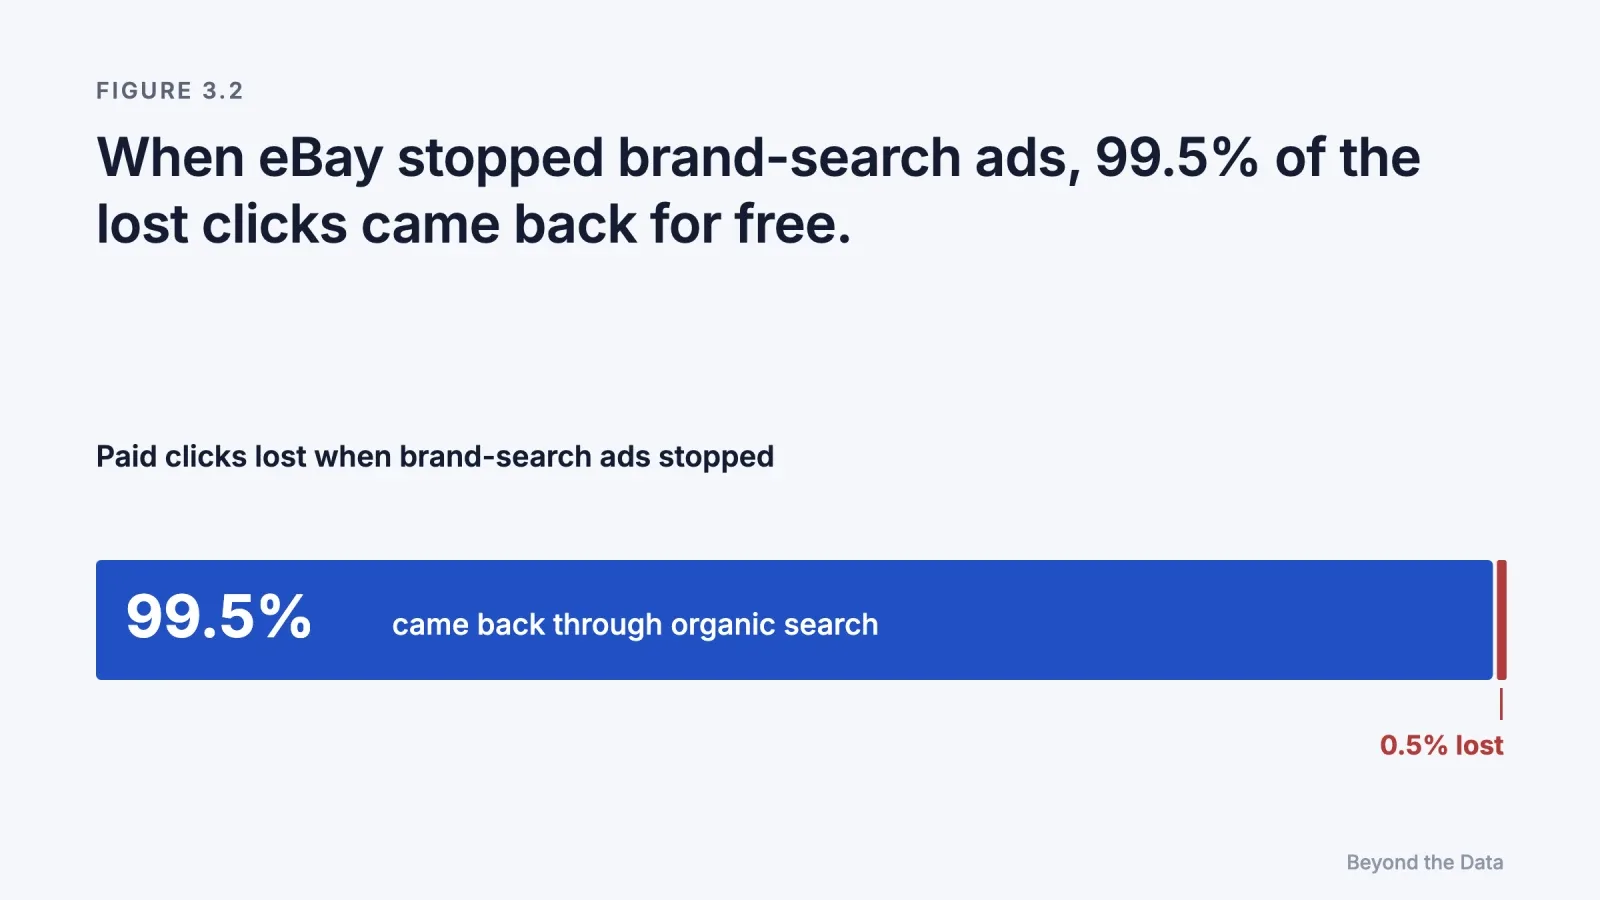
- When eBay switched off brand-keyword search ads, 99.5% of the lost paid clicks came back through organic search (Blake et al., 2015). [Experiment]
- Across 2,226 Meta experiments, 7-day last-click attribution explained 19% of the variation in incremental conversions per dollar; a model calibrated on experiments explained 88% (Gordon et al., 2026). [Experiment]
- In epidemiology, the fractions of disease attributable to different causes have no upper limit and can sum to well over 100% (Rothman, 2002). [Textbook principle]
Short answer. An attribution model divides the credit for a sale among the ads a customer encountered before buying. Every model forces the shares to add up to exactly 100%. Causal effects do not obey that rule: when channels reinforce each other, the sales lost by removing each channel add up to more than 100%, and when they compete for the same buyers, to less. So the division can describe the customer journey, but it cannot tell you what each channel caused.
What is an attribution model?
An attribution model is a rule that divides the credit for a sale among the ads and channels a customer encountered before buying. Last click gives all credit to the final touch. Linear divides it equally. Data-driven models estimate each channel's share from the paths of past customers.
| Model | How it assigns credit | What it hides |
|---|---|---|
| Last click | All to the final click | Channels that created demand earlier; it inflates brand search and retargeting |
| First click | All to the first touch | Steps that closed the sale |
| Linear | Equal shares | Which touch actually mattered |
| Time decay | More to touches near the sale | Early touches in long decisions |
| Position-based | Fixed shares to first and last, remainder to the middle | That the shares are arbitrary |
| Data-driven (Shapley, Markov) | From the association between a touch and conversion across many paths | That the association is still a correlation: it does not ask whether the sale would have happened without the touch |
Platforms have narrowed the choice. Google Analytics 4 removed first click, linear, time decay and position-based models in November 2023; Google Ads now offers last click and data-driven, with data-driven as the default for most conversion actions (Google, 2026). [Platform]
How do data-driven models work?
Most data-driven attribution descends from two ideas.
The Shapley value comes from cooperative game theory (Shapley, 1953). It divides a joint payoff among players by averaging each player's marginal contribution over every possible order of arrival. Applied to advertising, the "players" are channels and the payoff is conversions. One of its defining properties, usually called efficiency, is that the shares add up exactly to the total. Singal and colleagues (2022) show that the classical Shapley value needs a counterfactual adjustment before it can be given a causal reading in advertising.
Markov chain models treat the customer journey as a sequence of states and measure how much the conversion probability falls when a channel is removed from the graph. Anderl and colleagues (2016) applied this to four data sets with at least seven channels each and found credit allocations that differed markedly from last click, with carryover effects within channels and spillover effects between them. [Observational]
Both methods are a large improvement over last click as descriptions of the journey. Both are still built from observed paths. A path in which a customer saw a retargeting ad and bought is evidence that the two co-occurred. It is not evidence that the ad caused the purchase, for the reasons set out in Chapters 1 and 4.
Why do causal effects add up to more than 100%?
Take a store that sells 20 units a month without advertising. Instagram alone raises sales to 30. Search alone raises them to 50. Both together raise them to 100. Advertising adds 80 units.
| Scenario | Sales | Lost if this channel is switched off |
|---|---|---|
| No advertising | 20 | |
| Instagram only | 30 | |
| Search only | 50 | |
| Both channels | 100 | |
| Switch off Instagram | 50 | 50 |
| Switch off Search | 30 | 70 |
| Sum of losses | 120 = 150% of the 80 added |
Illustrative example.
Switching off either channel loses more than its "share", because each channel needs the other. The losses add up to 120, which is 150% of the 80 sales that advertising added. Any multi-touch attribution model has to squeeze those 120 lost sales into 80 units of credit, and each model does it with its own rule. When the effect exists only in combination, there is no single natural answer to "what share belongs to Instagram?"; a causal split exists only under stated assumptions about how interactions are shared. The Shapley value is one such set of assumptions and, as noted above, needs a counterfactual adjustment before it can be read causally (Singal et al., 2022).
Epidemiology faced the same arithmetic decades ago. In Rothman's textbook example, 75% of cases of a disease are attributable to smoking and 67% to alcohol, a total of 142%. His conclusion is that the sum of the fractions attributable to different component causes has no upper limit (Rothman, 2002; Rothman & Greenland, 2005).

Is there real evidence that channels reinforce each other?
Yes, and the strongest evidence links display or video advertising with search.
| Study | Design | Finding |
|---|---|---|
| Lewis & Nguyen (2015) | Field experiment | Display ads raise searches for the advertised brand by 30–45% |
| Kireyev, Pauwels & Gupta (2016) | Time-series model | Display exposure also increases search clicks, which raises search advertising costs |
| Li & Kannan (2014) | Model and field experiment | E-mail and display trigger visits through search and referral; model-based channel credits differ clearly from the metrics firms used |
| Naik & Raman (2003) | Market data, Dockers | Evidence of synergy between TV and print |
| Guitart & Hervet (2025) | Geographic experiment | Television and branded search ads interact |
The practical consequence is direct. If last-click numbers make display look weak and display is cut, search can weaken with it, because display was creating some of the demand that search was collecting.
Can the sum also fall below 100%?
Yes. When two channels reach the same buyers who would have bought anyway, removing either one costs little, because the other or no ad at all would have captured the sale. The clearest case is brand search. In a large field experiment, eBay switched off its paid search ads on brand keywords. Of the paid clicks that disappeared, 99.5% returned through organic search, and there was no measurable short-term benefit from the ads (Blake, Nosko & Tadelis, 2015). [Experiment]
[Our reading] Brand search ads and retargeting both tend to reach buyers who have already decided. Their causal effects can sum to well below their attributed share. Last click is the model that rewards them most.
How well does attribution predict what an experiment would find?
Poorly on size; on direction it is right in most campaigns. Gordon, Moakler and Zettelmeyer (2026) used 2,226 experiments run on Meta to test how well different measures predict the true incremental effect per dollar. The industry-standard 7-day last-click measure explained 19% of the variation (out-of-sample R² of 0.19). Their experiment-calibrated method, PIE (predicted incrementality by experimentation), explained 88%. Last click reached the same decision as the experiment in most campaigns but pointed the wrong way in 12–20% of them. [Experiment; authors include Meta employees]
The finding is important for two reasons. It shows how much information attribution throws away. It also shows that attribution can become far more useful when it is calibrated against experiments, which is the subject of Chapter 7.
What is attribution good for, then?
[Our reading] Attribution remains useful for three jobs, as long as it is not asked to do a fourth.
- Describing journeys. Which channels appear in converting paths, in what order, and how long the path takes.
- Fast, rough direction. Daily optimisation within a channel, where the alternative is no signal at all.
- Spotting change. A sudden shift in attributed share is a reason to investigate.
The fourth job, deciding how much budget each channel deserves, requires an estimate of what each channel causes at the margin. Attribution does not provide it.
The limit of this chapter
An attribution rule cannot prove a cause, and it cannot say why a number moved. When attributed revenue falls by 20%, a marketer needs to know whether the mix of customers changed, the conversion rate changed, or traffic changed, and whether any of it was caused by advertising. Chapter 4 looks at what goes wrong when we read causes from observational data.
References
- Anderl, E., Becker, I., von Wangenheim, F., & Schumann, J. H. (2016). Mapping the customer journey: Lessons learned from graph-based online attribution modeling. International Journal of Research in Marketing, 33(3), 457–474. doi:10.1016/j.ijresmar.2016.03.001
- Blake, T., Nosko, C., & Tadelis, S. (2015). Consumer heterogeneity and paid search effectiveness: A large-scale field experiment. Econometrica, 83(1), 155–174. doi:10.3982/ECTA12423 [Nosko and Tadelis conducted the study while working at eBay]
- Gordon, B. R., Moakler, R., & Zettelmeyer, F. (2026). Predicted incrementality by experimentation (PIE) for ad measurement. arXiv:2304.06828v2. [Moakler is a Meta employee]
- Guitart, I. A., & Hervet, G. (2025). Exploring the interaction between television and branded search advertising: Implications for real-time syncing strategies. Journal of the Academy of Marketing Science, 53(6), 1692–1714. doi:10.1007/s11747-025-01103-7
- Kireyev, P., Pauwels, K., & Gupta, S. (2016). Do display ads influence search? Attribution and dynamics in online advertising. International Journal of Research in Marketing, 33(3), 475–490. doi:10.1016/j.ijresmar.2015.09.007
- Lewis, R. A., & Nguyen, D. (2015). Display advertising's competitive spillovers to consumer search. Quantitative Marketing and Economics, 13(2), 93–115. doi:10.1007/s11129-015-9155-0
- Li, H., & Kannan, P. K. (2014). Attributing conversions in a multichannel online marketing environment: An empirical model and a field experiment. Journal of Marketing Research, 51(1), 40–56. doi:10.1509/jmr.13.0050
- Naik, P. A., & Raman, K. (2003). Understanding the impact of synergy in multimedia communications. Journal of Marketing Research, 40(4), 375–388. doi:10.1509/jmkr.40.4.375.19385
- Rothman, K. J. (2002). Epidemiology: An Introduction. Oxford University Press, ch. 2.
- Rothman, K. J., & Greenland, S. (2005). Causation and causal inference in epidemiology. American Journal of Public Health, 95(S1), S144–S150. doi:10.2105/AJPH.2004.059204
- Shapley, L. S. (1953). A value for n-person games. In Contributions to the Theory of Games II, Annals of Mathematics Studies 28, 307–317. doi:10.1515/9781400881970-018
- Singal, R., Besbes, O., Desir, A., Goyal, V., & Iyengar, G. (2022). Shapley meets uniform: An axiomatic framework for attribution in online advertising. Management Science, 68(10), 7457–7479. doi:10.1287/mnsc.2021.4263
 Edip Ali Avcıbaşı · Co-founder & CAOCo-founder and CAO of Meerkads and Byte Digital. Has run agency operations since 2020, with a background in digital marketing, SEO and marketplaces.