
On this page 7 sections
Key findings
- Across 56 studies and 751 estimates, a 1% increase in advertising raises sales by about 0.12% in the short run and 0.24% in the long run (Sethuraman et al., 2011). [Observational, meta-analysis]
- For 288 consumer brands on US television, the estimated effects were smaller still, and for more than 80% of brands the last dollar of TV advertising lost money (Shapiro et al., 2021). [Observational]
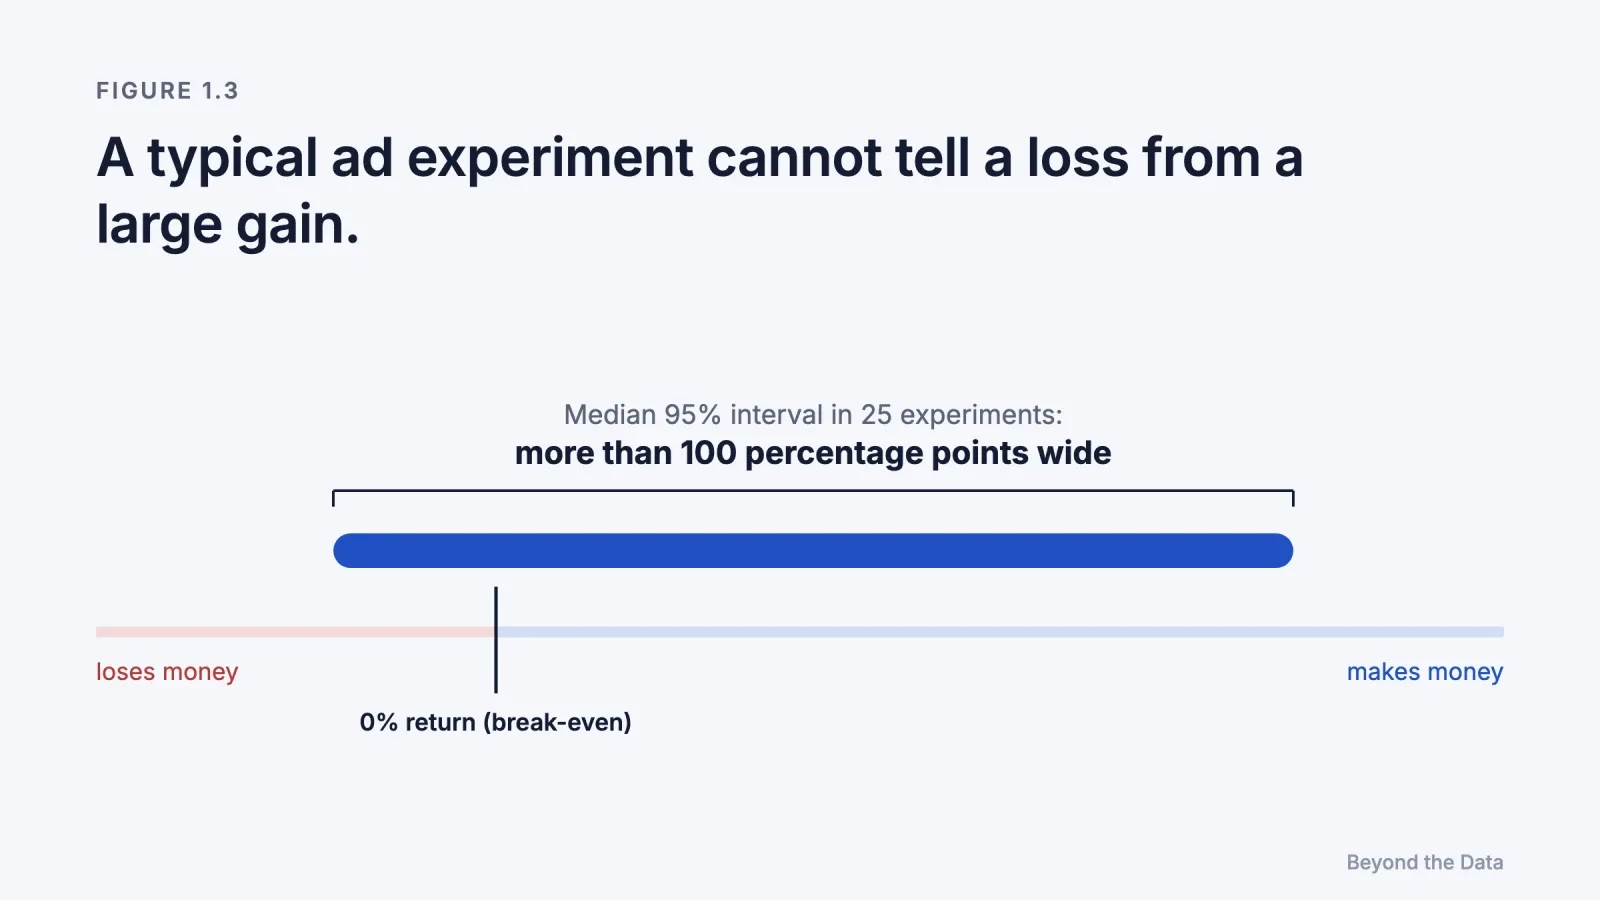
- In 25 large online experiments, the median 95% confidence interval for return on investment was more than 100 percentage points wide (Lewis & Rao, 2015). [Experiment]
- A conclusive experiment can require more than 10 million person-weeks of data (Lewis & Rao, 2015). [Experiment]
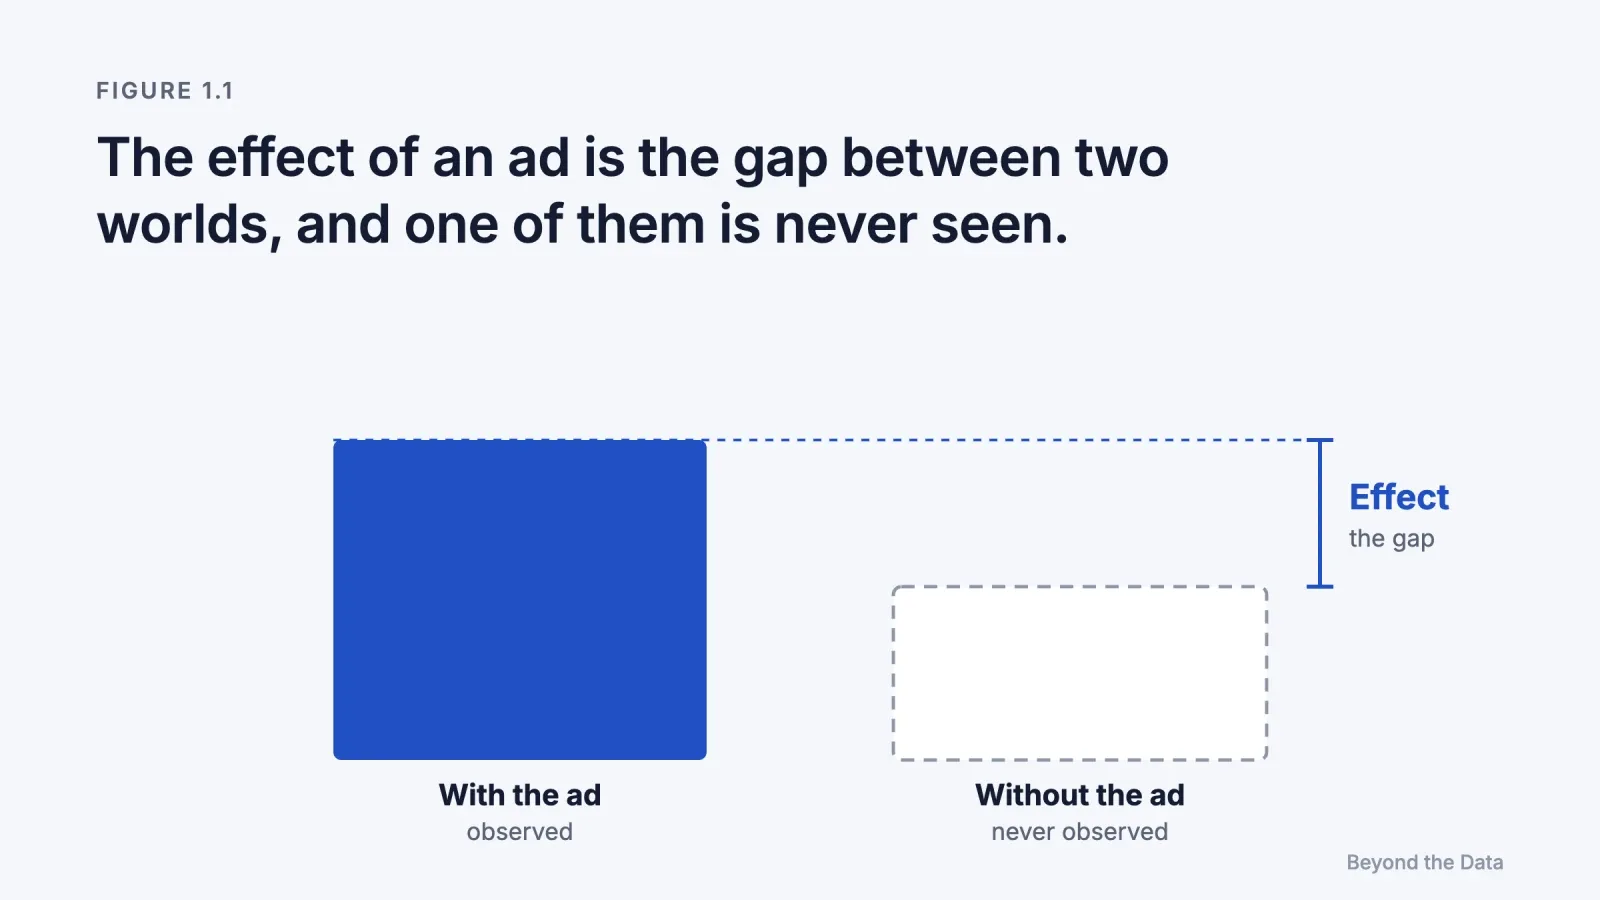
Short answer. The effect of an ad is the difference between the sales that happened and the sales that would have happened without it. The second number is never observed. It has to be inferred, and the inference is hard for three reasons: the effect is small, individual sales are very noisy, and ads are shown to people who were already likely to buy.
What exactly is "the effect" of an ad?
The causal effect of an advertisement is the difference between what a customer did after seeing it and what the same customer would have done without seeing it. Statisticians call the two quantities potential outcomes (Imbens & Rubin, 2015). For any one person, only one of them is ever observed. A customer who saw the ad and bought cannot also be observed not seeing it.
Every method in this book is a way of estimating the missing outcome. Some estimate it well, some badly, and some do not try at all. A report that counts purchases after an ad click estimates nothing about the missing outcome. It records that a click and a purchase happened in sequence.
This is why the book separates two words. Credit is the share of a sale that a report assigns to an ad. Cause is the share of a sale that would disappear if the ad were removed. Credit is a bookkeeping choice and is always available. Cause is a fact about the world and is never directly visible.
How large are advertising effects?
Smaller than most dashboards suggest. Marketing scientists express the effect of advertising as an elasticity: the percentage change in sales for a 1% change in advertising.
| Study | Scope | Finding | Evidence |
|---|---|---|---|
| Sethuraman, Tellis & Briesch (2011) | 56 studies, 751 short-term and 402 long-term elasticities, 1960–2008 | Average elasticity 0.12 short term, 0.24 long term; down from 0.22 and 0.41 in an earlier meta-analysis; declining over time | Observational, meta-analysis |
| Lodish et al. (1995) | 389 split-cable TV experiments | Raising budgets relative to competitors does not, in general, raise sales. For 89 established products the average elasticity was 0.05, and 33% of estimates were significant at a lenient one-tailed 20% level (as summarised by Shapiro et al.) | Experiment |
| Shapiro, Hitsch & Tuchman (2021) | 288 consumer packaged goods brands, US TV | Elasticities far smaller than earlier literature, many not significant; marginal ROI negative for over 80% of brands; overall ROI positive for about one third | Observational |
Two things follow. First, a typical advertiser who raises spend by 10% should expect sales to rise by about 1%, often less. Second, the effect has been shrinking or was overstated in earlier work, or both. Shapiro and colleagues argue that published estimates were selected for being large and significant, while their own sample was not.
None of this says advertising does not work. Shapiro's data show that for about one third of brands the advertising they already run is profitable overall, even when the next dollar is not. It says that the effect is a small signal that has to be separated from a large background.

Why can't we just compare buyers who saw the ad with buyers who didn't?
Because the two groups were different before the ad was shown. Online advertising is targeted on purpose. Platforms show ads to people whose behaviour predicts a purchase: recent visitors, people who searched for the product, people similar to past buyers. If the ad then "converts" at four times the rate of the general population, most of that gap existed before the ad.
Lewis and Rao (2015) describe this as the core weakness of observational methods: selection, created by targeting, is large compared with the effect being measured. A second bias is subtler. Lewis, Rao and Reiley (2011) found that people who are very active online on a given day are both more likely to see an ad and more likely to do everything else, including visiting the advertiser's site. In one of their Yahoo experiments, visits to Yahoo jumped among exposed users, but the same jump appeared in the placebo group that saw an unrelated ad. They called it activity bias. [Experiment]
Chapter 4 shows how large these biases become in practice.
Why is sales data so noisy?
Because a single customer's purchases vary enormously compared with the cost of reaching that customer. Lewis and Rao (2015) ran 25 field experiments with major US retailers and brokerages, covering $2.8 million of online advertising. In their data, the standard deviation of a customer's sales was typically about ten times its mean. Against that variation, an ad that costs a few cents per person and lifts the average by a fraction of a percent is almost invisible. [Experiment]
The consequences are concrete:
- The median 95% confidence interval for ROI in their experiments was more than 100 percentage points wide. An honest result often reads "somewhere between losing money and doubling it".
- A conclusive experiment could require more than 10 million person-weeks of observation, which is beyond the reach of most advertisers.
They called this "the unfavorable economics of measuring the returns to advertising". It is the main reason why so much measurement relies on cheaper methods that do not use random assignment, and therefore why so much measurement is biased.
What does this mean for an advertiser?
[Our reading] Three practical consequences follow from the evidence above.
- A large reported return is more likely to be wrong than a small one. Given typical elasticities, a channel reporting a tenfold return on ad spend is more likely to be capturing selection than causing sales.
- A single week of data rarely settles anything. Sales noise means that week-to-week swings in a channel's reported performance mostly reflect noise and seasonality.
- The missing outcome has to be estimated deliberately. If no method in the reporting stack tries to estimate what would have happened without the ads, the stack is reporting credit, not cause.
The limit of this chapter
This chapter treated the observed numbers as correct and asked why they do not show causes. Before going further, we have to check that assumption. The numbers in an advertising report are recorded by tracking systems, filtered by consent, and sometimes estimated by models. Chapter 2 asks what a reported conversion actually records.
References
- Imbens, G. W., & Rubin, D. B. (2015). Causal Inference for Statistics, Social, and Biomedical Sciences. Cambridge University Press. doi:10.1017/CBO9781139025751
- Lewis, R. A., & Rao, J. M. (2015). The unfavorable economics of measuring the returns to advertising. Quarterly Journal of Economics, 130(4), 1941–1973. doi:10.1093/qje/qjv023
- Lewis, R. A., Rao, J. M., & Reiley, D. H. (2011). Here, there, and everywhere: Correlated online behaviors can lead to overestimates of the effects of advertising. Proceedings of WWW 2011, 157–166. doi:10.1145/1963405.1963431
- Lodish, L. M., Abraham, M., Kalmenson, S., Livelsberger, J., Lubetkin, B., Richardson, B., & Stevens, M. E. (1995). How T.V. advertising works: A meta-analysis of 389 real world split cable T.V. advertising experiments. Journal of Marketing Research, 32(2), 125–139. doi:10.2307/3152042
- Sethuraman, R., Tellis, G. J., & Briesch, R. A. (2011). How well does advertising work? Generalizations from meta-analysis of brand advertising elasticities. Journal of Marketing Research, 48(3), 457–471. doi:10.1509/jmkr.48.3.457
- Shapiro, B. T., Hitsch, G. J., & Tuchman, A. E. (2021). TV advertising effectiveness and profitability: Generalizable results from 288 brands. Econometrica, 89(4), 1855–1879. doi:10.3982/ECTA17674
 Edip Ali Avcıbaşı · Co-founder & CAOCo-founder and CAO of Meerkads and Byte Digital. Has run agency operations since 2020, with a background in digital marketing, SEO and marketplaces.