Tracking and Attribution
True ROAS vs Blended ROAS: Formulas, MER and How to Calculate Them
Your ad platforms say one ROAS, your Shopify store says another. Here is how platform ROAS, blended ROAS, MER and true ROAS differ, how to calculate each one, and which to use for channel decisions versus business health.
 Damla Teoman Avcıbaşı · 10 min read

Summarize with AI
Contents 11 sections
- Platform-reported ROAS: what the ad accounts tell you
- Blended ROAS and MER: the store-level view
- True ROAS: the revenue you actually kept
- A worked example with round numbers
- Why platform ROAS adds up to more than your store revenue
- Platform vs blended vs true ROAS at a glance
- When to use which metric
- How to calculate true ROAS in practice
- Common mistakes
- FAQ
- See your true ROAS without the spreadsheet
Almost every week someone shows me a screenshot of their ad accounts with a healthy ROAS on every platform, then a Shopify report where the month looks flat. Both numbers are "correct". They just answer different questions. This guide walks through the three versions of ROAS you will run into, how each one is calculated, and which one to trust for which decision.
Platform-reported ROAS: what the ad accounts tell you
Platform ROAS is the number you see inside Meta Ads, Google Ads or TikTok Ads. The formula is simple:
Platform ROAS = conversion value attributed by the platform / spend on that platform
The key word is "attributed". Each platform decides which purchases it gets credit for, based on its own tracking, its own attribution window (for example, a click or view within a set number of days) and its own modelling for conversions it cannot observe directly. That makes platform ROAS useful for comparing campaigns, ad sets and creatives inside one platform. It does not tell you how much money landed in your store because of your ads.
If you have ever wondered why the numbers never line up, we covered the mechanics in why your Meta Ads dashboard and Shopify revenue never match.
Blended ROAS and MER: the store-level view
Blended ROAS steps out of the ad platforms and looks at the business as a whole:
Blended ROAS = total store revenue / total ad spend across all platforms
It ignores attribution entirely. It does not care which platform "caused" an order; it only asks whether total revenue moved in a healthy ratio to total paid media spend. Because it uses your store as the source of truth, it cannot be inflated by overlapping credit.
MER (marketing efficiency ratio) is a close relative, and the two terms are often used interchangeably. Here is the distinction I use and will stick to in this article:
- Blended ROAS = total store revenue / total ad spend (Meta, Google, TikTok and any other paid media).
- MER = total store revenue / total marketing spend (ad spend plus other marketing costs you choose to include, such as agency fees, influencer payments or tooling).
If paid media is your only marketing cost, the two numbers are identical. The more you spend outside the ad platforms, the lower MER will be compared to blended ROAS. Neither is wrong; just be explicit about what sits in the denominator, and keep it consistent month to month.
True ROAS: the revenue you actually kept
"True ROAS" has no single industry definition. Some people use it as a synonym for blended ROAS, others mean a profit-based figure, and some tools mean their own attributed number. So here is the definition this article uses:
True ROAS = (store revenue − refunds) / total ad spend
In other words, blended ROAS after you remove the money that went back to customers. Refunds are the gap most often ignored, and in categories like apparel they can be large enough to change a decision.
You can take it one step further and move from revenue to profit:
Profit-based true ROAS (sometimes called POAS) = (net revenue − cost of goods sold) / total ad spend
This tells you how many dollars of gross profit each ad dollar generated. A result above 1.0 means ads paid for themselves out of gross profit, before shipping, payment fees and overheads. Whichever version you use, write the definition down and share it with everyone who reads the report.
A worked example with round numbers
Example only: the figures below are hypothetical and chosen to keep the maths easy.
Imagine a store with one month of activity:
- Ad spend: Meta $5,000, Google $3,000, TikTok $2,000. Total ad spend: $10,000.
- Other marketing costs (agency fee, influencer posts): $2,000.
- Platform-reported conversion value: Meta $20,000, Google $15,000, TikTok $6,000. Total claimed: $41,000.
- Shopify gross sales for the month: $30,000.
- Refunds: $3,000.
- Cost of goods sold on the kept orders: $10,800.
Now the metrics:
- Platform ROAS (combined): $41,000 / $10,000 = 4.1
- Blended ROAS: $30,000 / $10,000 = 3.0
- MER: $30,000 / $12,000 = 2.5
- True ROAS (net revenue): ($30,000 − $3,000) / $10,000 = 2.7
- Profit-based true ROAS: ($27,000 − $10,800) / $10,000 = 1.62
Same month, same store, five different "ROAS" numbers between 1.62 and 4.1. The platforms are not lying, and neither is Shopify. They are measuring different things. A useful cross-check is break-even ROAS: with a 60% gross margin on net revenue, break-even true ROAS is 1 / 0.6 ≈ 1.67. At 2.7, this store is covering its product cost and ad spend with $6,200 of gross profit left over, before other costs.
Why platform ROAS adds up to more than your store revenue
In the example, the platforms claimed $41,000 of revenue from a store that took $30,000 in total, including organic, email and direct orders. That is normal, and it happens for a few general reasons:
- Every platform claims its own credit. A customer who saw a TikTok video, clicked a Meta ad and then searched your brand on Google can be counted as a conversion by all three.
- Attribution windows overlap. Each platform uses its own click and view windows, so the same purchase can fall inside several of them at once.
- Modelled conversions. When tracking is limited, platforms estimate conversions they could not observe directly. Estimates are reasonable on average but rarely add up neatly across platforms.
- Different revenue definitions. Platforms usually report the value passed at checkout, which may include tax or shipping and will not reflect later refunds.
The sum of platform-reported revenue is therefore not a measure of anything real. Treat each platform number as that platform's view of its own contribution, and use store data for the total. We go deeper on this in why your Facebook Ads ROAS is misleading you.
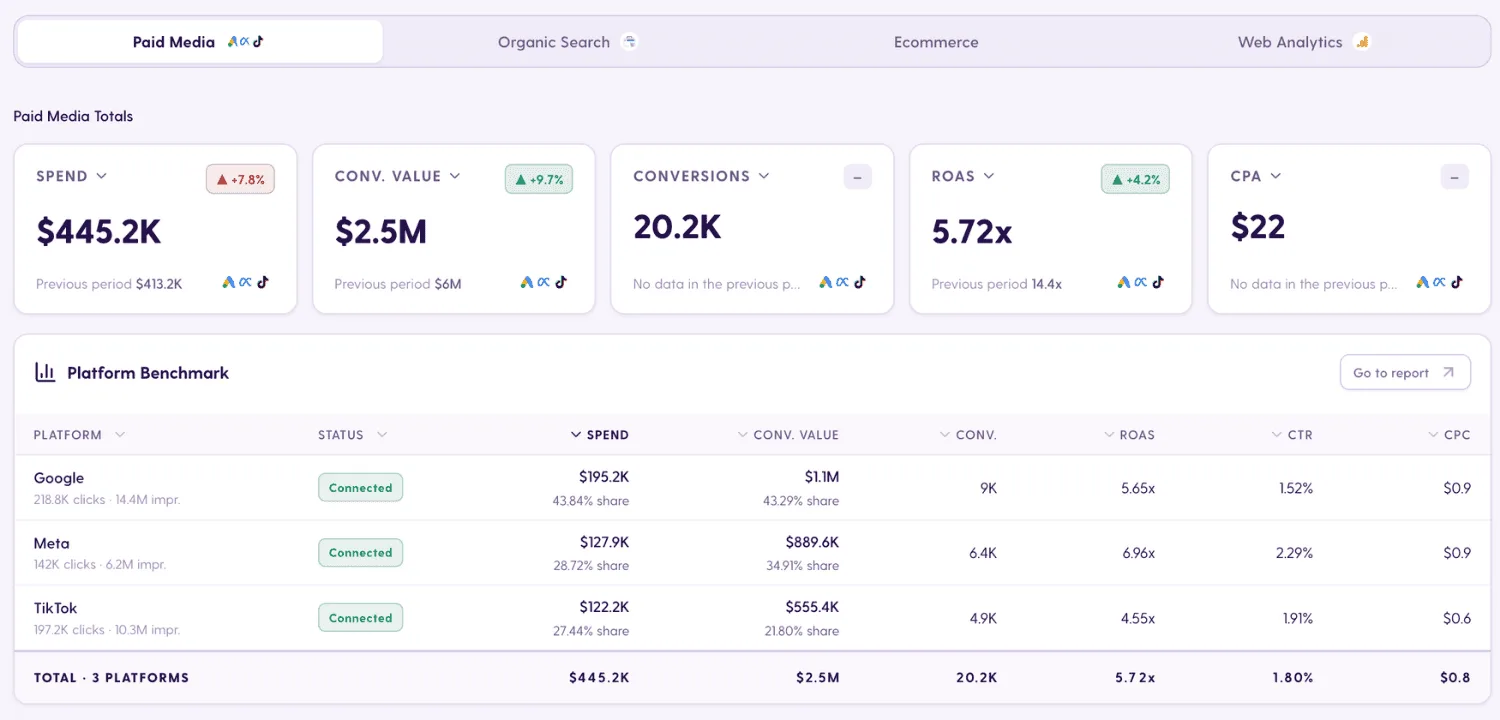
Platform vs blended vs true ROAS at a glance
| Metric | What it measures | Formula | Best used for | Blind spots |
|---|---|---|---|---|
| Platform ROAS | Revenue each ad platform attributes to itself | Platform-attributed conversion value / platform spend | Comparing campaigns, ad sets and creatives within one platform | Overlapping credit, modelled conversions, ignores refunds and organic sales |
| Blended ROAS (and MER) | Total store revenue relative to total ad spend (MER: total marketing spend) | Store revenue / total ad spend (MER: store revenue / total marketing spend) | Business health, budget pacing, month-over-month trend | No channel breakdown, includes organic revenue, ignores refunds and margin |
| True ROAS | Revenue the store kept after refunds, optionally net of product cost | (Revenue − refunds) / total ad spend, or (net revenue − COGS) / total ad spend | Profitability checks, setting realistic targets, reporting to owners and finance | Definitions vary across the industry, needs reliable refund and COGS data, still no channel attribution |
When to use which metric
The simplest rule I give brands and agencies: use platform ROAS to optimise inside a channel, and use blended or true ROAS to judge the business.
Channel optimisation
When you are deciding which ad set to scale, which creative to pause or which campaign deserves more budget within Meta or Google, platform ROAS is the right lens. It is consistent within the platform, granular, and updated quickly. Just compare like with like: same platform, same attribution setting, same period.
Business health
When the question is "is our advertising working overall?" or "can we afford to spend more next month?", move to blended ROAS and true ROAS. If platform ROAS rises while blended ROAS falls, the platforms are probably claiming more credit for sales that would have happened anyway, or one channel is cannibalising another.
Reporting to clients and leadership
Show both views side by side. Platform ROAS explains what the team is doing; true ROAS shows what it is worth. Agencies that report only platform numbers eventually have an awkward conversation when the client's finance team opens Shopify.
For a broader look at connecting the two worlds, see ecommerce vs marketing performance.
How to calculate true ROAS in practice
Doing it by hand is possible. A practical routine looks like this:
- Pick one timeframe and time zone and use it for every source. Ad platforms and your store may use different time zones by default.
- Export total spend from every ad platform for that period and add it up.
- Pull store revenue from Shopify for the same period, and decide whether you use gross sales or net sales (and whether tax and shipping are included).
- Subtract refunds issued for orders in that period.
- Optionally subtract cost of goods sold for a profit-based view.
- Divide by total ad spend, and calculate MER separately if you have other marketing costs.
- Repeat every week so you can see the trend, not just a single snapshot.
The maths is easy. The pain is pulling three or four exports, matching dates and doing it again next week. That is the part we automated in Meerkads.
How Meerkads calculates it automatically
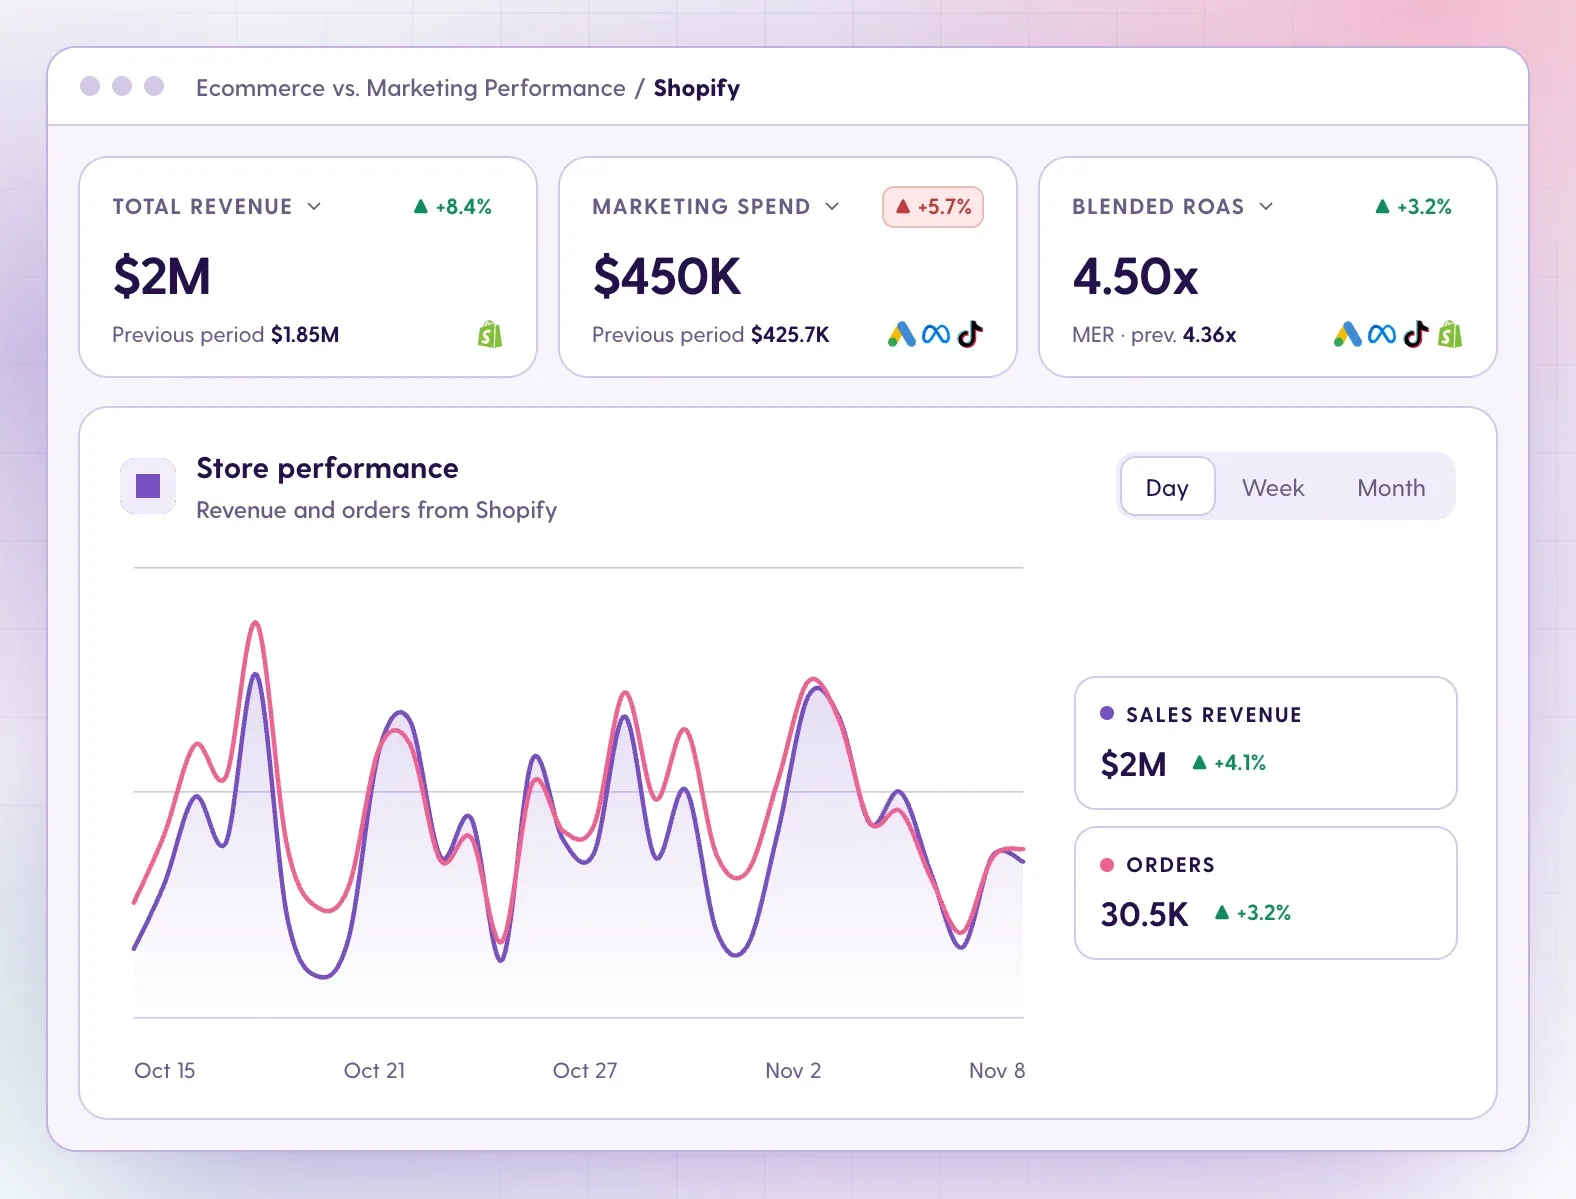
Meerkads connects Google Ads, Meta Ads and TikTok Ads to your Shopify store, so ad spend is matched against real store sales, including product revenue, refunds and cost of goods. The Ecommerce vs Marketing Performance page puts revenue, spend and blended ROAS on one screen next to your Shopify store performance.
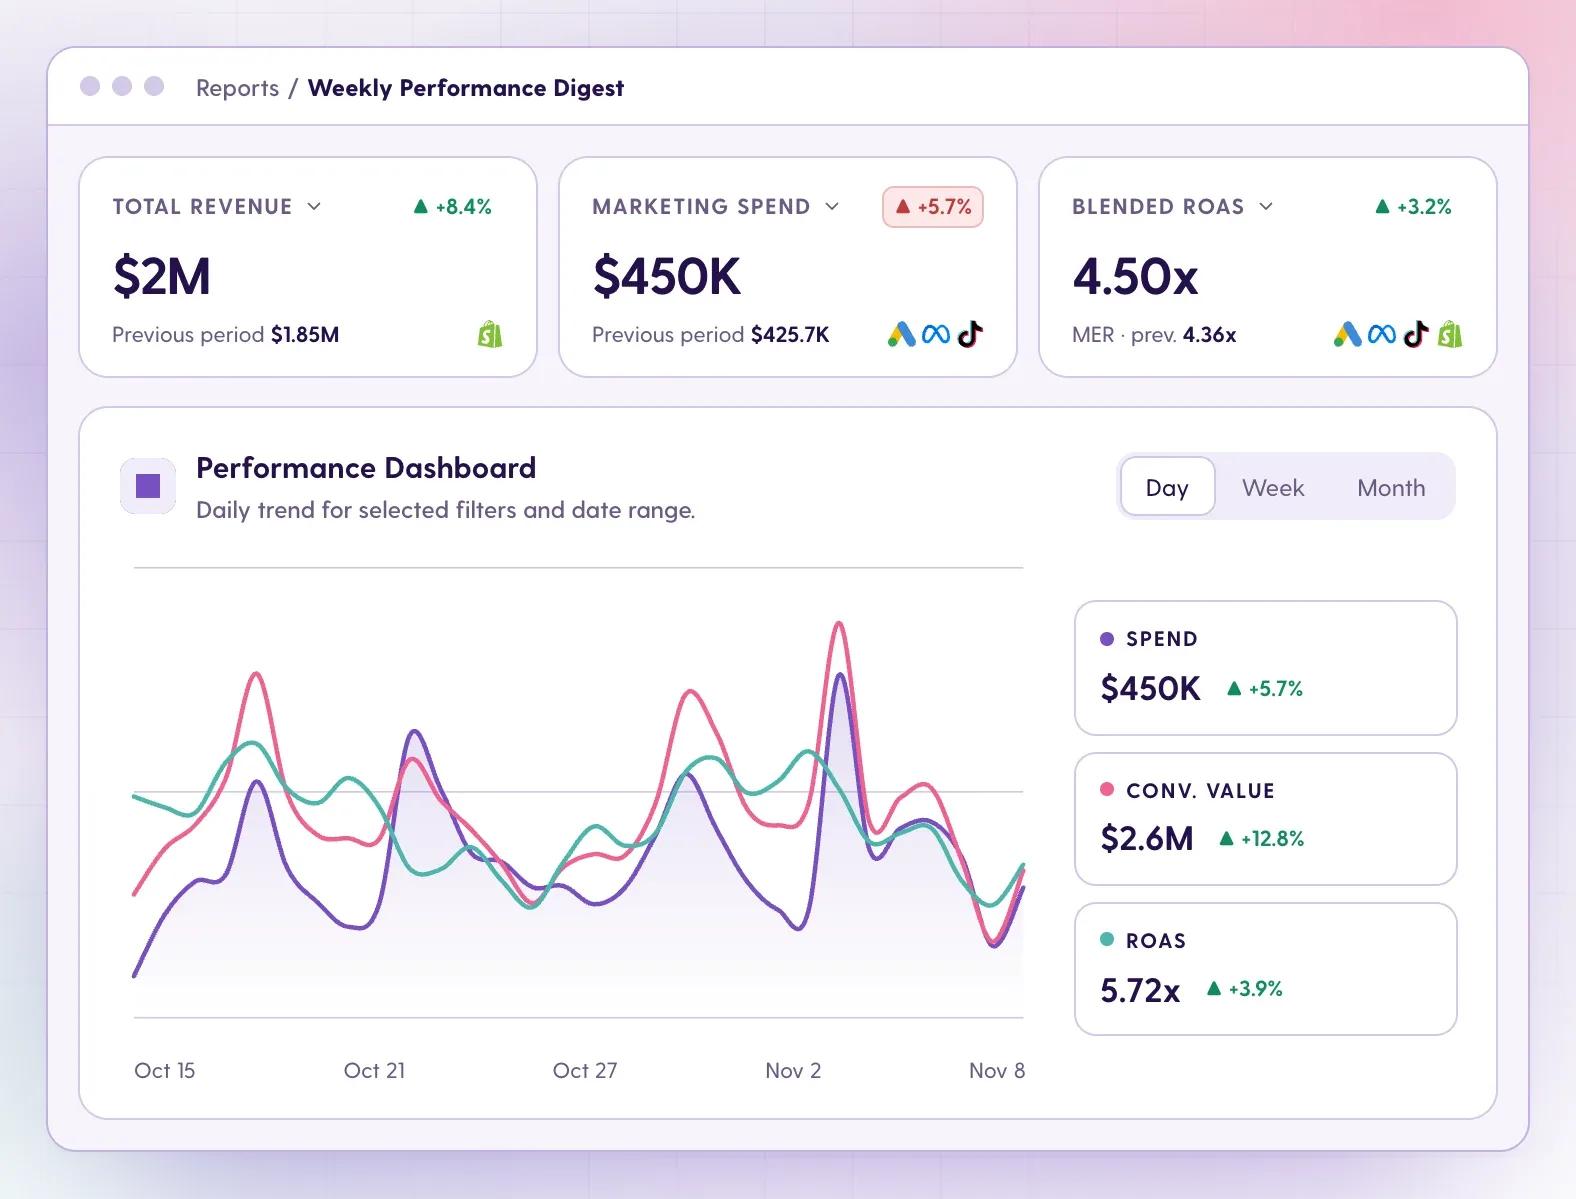
The scheduled Weekly Performance Digest in Reports shows total revenue, marketing spend and blended ROAS with MER alongside, so the store-level view arrives in your inbox every week instead of being rebuilt in a spreadsheet.
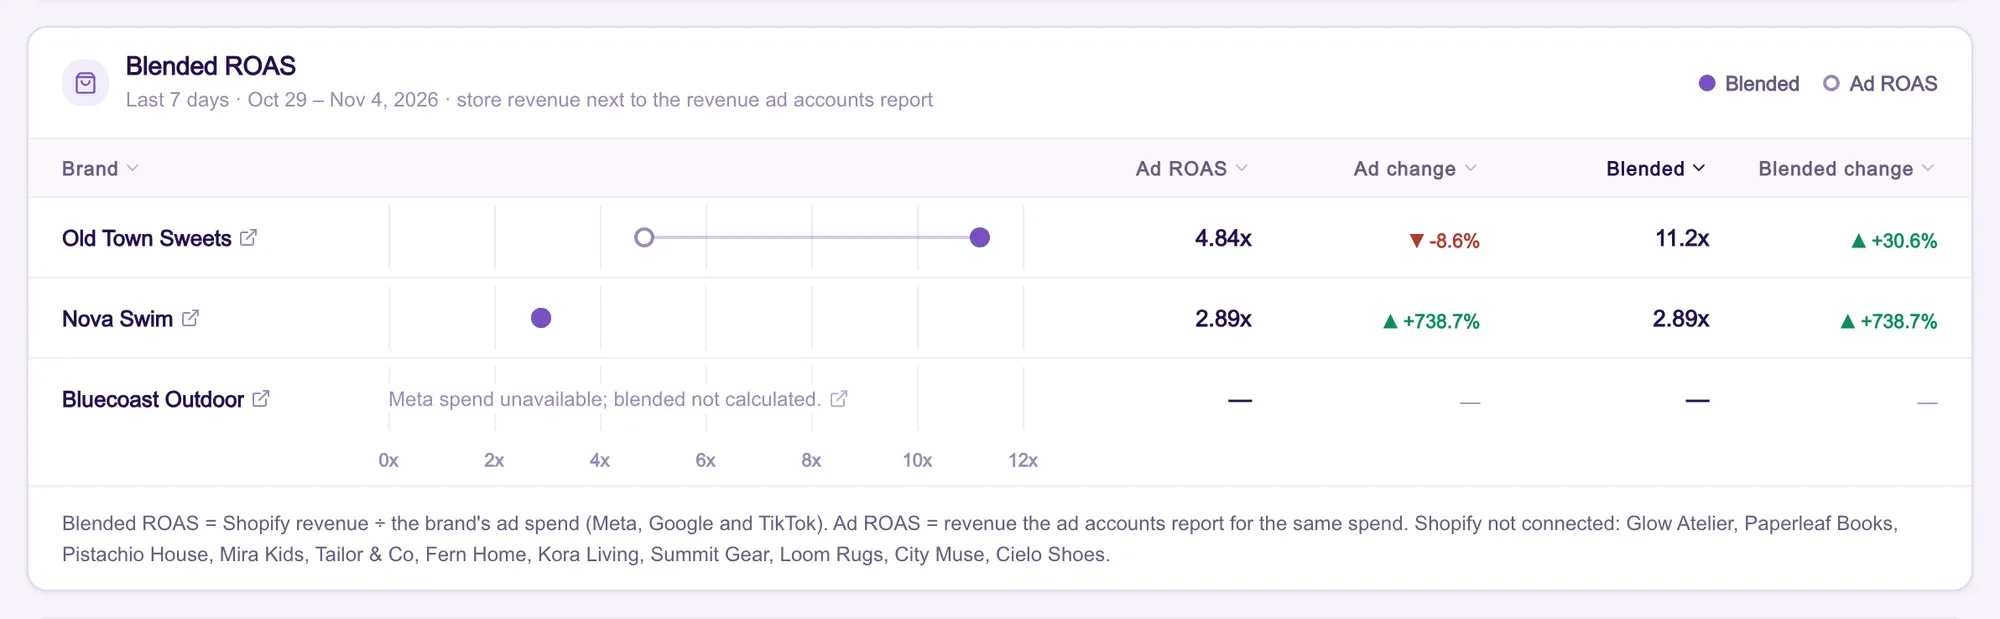
For agencies managing several brands, the portfolio view compares blended ROAS against Shopify revenue next to ad-reported ROAS for each brand, which makes it easy to spot where platform numbers and store reality are drifting apart. More on that workflow on our agencies page.
You can also set alerts in Monitor & Alerts for ROAS floors, so a drop gets flagged before the weekly review.
Common mistakes
Ignoring refunds
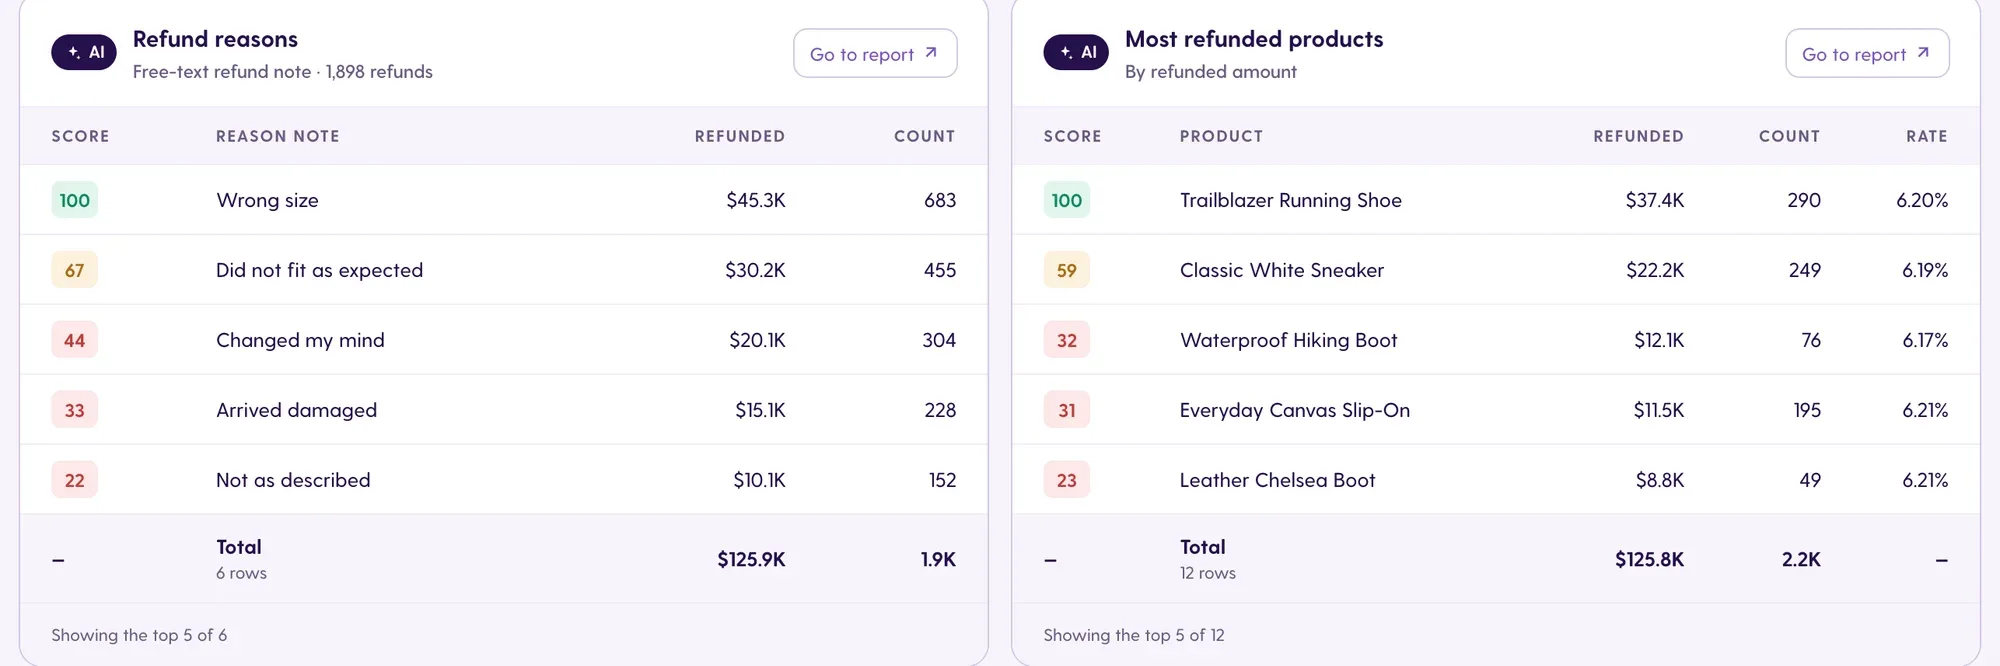
Gross sales look great until returns come back. If refunds are not subtracted, your "true" ROAS is just blended ROAS with a nicer name. Watch which products drive refunds, too: a best seller by revenue can be a weak performer once returns are counted.
Timeframe and time zone mismatches
Comparing Meta spend for "last 7 days" in one time zone with Shopify revenue for a calendar week in another creates noise that looks like a performance change. Align both. Remember too that refunds often arrive weeks after the sale, so recent periods will look slightly better than they end up.
Mixing gross and net
Using gross sales in one month and net sales in the next, or including tax and shipping in some reports and not others, makes trend lines meaningless. Choose one revenue definition and keep it.
Comparing blended ROAS across brands with different organic share
Blended ROAS includes every sale, including organic, email and returning customers. A brand with a strong community and lots of repeat buyers will show a higher blended ROAS than a new brand relying on paid acquisition, even if the new brand's ads are performing better. Compare each brand against its own history, or look at new vs returning customer mix before drawing conclusions.
Summing platform ROAS
Adding up platform-reported revenue and calling it total ad-driven revenue double counts sales, as the worked example showed. Keep platform numbers for channel decisions only. If a platform figure suddenly jumps or drops with no change in store revenue, check for a tracking issue: see how to spot attribution anomalies.
FAQ
What is the true ROAS formula?
There is no single industry standard. In this article, true ROAS = (store revenue − refunds) / total ad spend. A profit-based version subtracts cost of goods sold as well: (net revenue − COGS) / total ad spend. Whichever you use, state the definition in your reports.
What is the difference between blended ROAS and ROAS?
Platform ROAS uses revenue a single ad platform attributes to itself, divided by that platform's spend. Blended ROAS uses total store revenue divided by total ad spend across all platforms. Blended ROAS cannot be inflated by overlapping attribution, but it gives no channel breakdown.
Is MER the same as blended ROAS?
They are often used interchangeably. A useful distinction: blended ROAS divides store revenue by ad spend only, while MER divides store revenue by total marketing spend, including costs such as agency fees or influencers. If ads are your only marketing cost, the two are equal.
What is a good true ROAS?
It depends on your margins. Work out your break-even point first: with a 60% gross margin, break-even true ROAS on net revenue is roughly 1.67. Anything above that covers product cost and ad spend. Set targets from your own margins and history rather than generic benchmarks.
See your true ROAS without the spreadsheet
If you are rebuilding blended and true ROAS by hand every week, it is worth automating. Meerkads matches your ad spend with real Shopify revenue, refunds and cost of goods, and puts platform ROAS, blended ROAS and MER side by side. Read more about it for ecommerce brands, or check plans and the 7-day free trial.
Damla Teoman Avcıbaşı · Sales & Marketing LeadDamla Teoman Avcıbaşı is the Sales & Marketing Lead at Meerkads. Writes about AI in marketing, marketing tools and growth.