PPC
PPC Report Template: What to Include and How to Automate It
A section-by-section PPC report template you can copy, with the metrics and questions each part should answer, weekly vs monthly differences, common mistakes, and how to automate it with scheduled white-label reports and AI insights.
 Damla Teoman Avcıbaşı · 10 min read

Summarize with AI
Contents 9 sections
- What a good PPC report must answer
- The PPC report template, section by section
- PPC report template: sections, metrics, questions answered
- Weekly vs monthly PPC reports: what changes
- KPIs by business type: ecommerce vs lead gen
- Common PPC reporting mistakes
- How to automate your PPC report with Meerkads
- FAQ
- Turn the template into a report that builds itself
Most PPC reports fail in the same way. They show a lot of numbers, they look busy, and nobody who reads them knows what to do next. A good PPC report template fixes that by forcing every section to answer a question someone actually has: are we on track, where did the money go, what worked, what didn't, and what happens now.
This guide gives you a section-by-section PPC report template you can copy into your own deck, doc or dashboard. It covers what to include for clients and executives versus the PPC team, how weekly and monthly reports differ, which KPIs matter for ecommerce and lead gen, and the mistakes that make reports get ignored. At the end, you'll see how to automate the whole thing so you stop rebuilding it every month.
What a good PPC report must answer
Before you pick metrics, decide who is reading. A PPC report usually has two audiences, and they want different things from the same data.
For clients and executives
Owners, CMOs and clients want business answers, fast:
- Did paid media make us money? Revenue, leads or pipeline against spend, compared with the previous period and the target.
- Are we on budget? Spend to date, pacing and whether you will over- or underspend.
- What changed and why? One or two clear explanations, not twenty charts.
- What are you doing next? Concrete actions, with the decisions you need from them.
For the PPC team
Specialists need the diagnostic layer that explains those top-line numbers:
- Which campaigns, ad groups and ads are driving or dragging results.
- Where CPA rose or CTR fell, and whether it is a bid, budget, creative or tracking problem.
- Which search terms to add as keywords or negatives.
- Which creatives are fatiguing and need a refresh.
The practical answer is one report with layers: a one-page summary on top for decision makers, and detail underneath (or in an appendix) for the team. If your client has to scroll past keyword tables to find out whether revenue went up, the report is upside down.
The PPC report template, section by section
Copy this structure, then trim what your audience doesn't need.
Section 1: Executive summary
Three to five sentences, written last. State the headline result, the main reason behind it and the top action for next period. If someone only reads this paragraph, they should still be informed.
Section 2: KPI scorecard vs previous period and target
A small table of five to eight KPIs, each with three comparisons: this period, previous period (and change), and target. Mark which KPIs are on track and which are off. Pick KPIs that tie to business outcomes: spend, revenue or conversions, ROAS or CPA, and conversion rate. Leave impressions out of the scorecard unless awareness is the actual goal.
Section 3: Spend and pacing
Show spend to date against the budget for the period, the projected end-of-period spend and any budget changes you made. Flag days with unusual spend spikes or drops. Pacing problems are cheaper to fix in week two than in week four, which is why this section matters more in weekly reports.
Section 4: Channel and platform breakdown
Split spend, conversions, revenue and ROAS or CPA by platform: Google Ads, Meta Ads, TikTok Ads and any others you run. Add each platform's share of spend next to its share of revenue or conversions. A platform taking 50% of spend and delivering 20% of revenue is a conversation worth having.
Section 5: Campaign performance
List the main campaigns with spend, conversions, conversion value, ROAS or CPA, and change versus previous period. Sort by spend so the campaigns that matter most are at the top. Add a one-line comment for any campaign that moved significantly.
Section 6: Top and bottom ads and creatives
Show the three to five best and worst performing ads or creatives by your main efficiency metric, with enough spend to be meaningful. Note what the winners have in common (offer, angle, format) and what you will do with the losers: pause, rewrite or test a new variant. Watch for creatives whose CTR declines while frequency rises, a typical sign of creative fatigue.
Section 7: Search terms and keywords note
For search campaigns, a short note is enough for clients: new high-performing search terms promoted to keywords, wasted spend blocked with negatives, and any shifts in match type strategy. Keep the full search term list in the appendix for the team.
Section 8: Ecommerce outcome: revenue, blended ROAS, refunds
This is the section most PPC reports skip, and the one owners care about most. Platform-reported conversion value is the platform's view of credit, and Google, Meta and TikTok can each claim the same order. Add the store's view:
- Store revenue for the period (from Shopify or your store).
- Blended ROAS: total store revenue divided by total ad spend, ideally shown with MER.
- Refunds: refunded value and the products or reasons behind it, since refunded orders still count in platform ROAS.
Showing platform ROAS next to blended ROAS keeps everyone honest. If you want the full reasoning, read our guide to true ROAS.
Section 9: Insights and next steps
Three to five insights, each written as observation, cause and action. For example: "CPA on the brand campaign rose because a competitor started bidding on our name; we will raise the brand budget cap and add sitelinks." Then list next steps with owners and dates, plus any decisions you need from the client (budget approval, new landing page, stock updates).
Section 10: Appendix
Everything detailed that supports the story but would clutter it: full campaign and ad group tables, search term reports, audience and device breakdowns, tracking notes and definitions of each metric. The team uses it; executives can ignore it.
PPC report template: sections, metrics, questions answered
Use this table as a checklist when you build or review a PPC reporting template.
| Section | Key metrics | Question it answers |
|---|---|---|
| Executive summary | Headline result, main driver, top action | What happened and what do we do now? |
| KPI scorecard | Spend, revenue or conversions, ROAS or CPA, conversion rate vs previous period and target | Are we on track? |
| Spend and pacing | Spend to date, budget, projected spend | Will we hit, miss or overshoot budget? |
| Channel and platform breakdown | Spend, revenue, ROAS or CPA, share of spend vs share of revenue | Which platforms deserve more or less budget? |
| Campaign performance | Spend, conversions, value, ROAS or CPA, change | Which campaigns drive or drag results? |
| Top and bottom ads | CTR, CPA or ROAS, spend, frequency | Which messages and creatives work? |
| Search terms and keywords | New keywords, negatives added, wasted spend | Are we paying for the right searches? |
| Ecommerce outcome | Store revenue, blended ROAS, MER, refunds | Is paid media profitable for the business? |
| Insights and next steps | Observations, causes, actions, owners | So what, and who does what by when? |
| Appendix | Detailed tables, definitions, tracking notes | Where can I check the detail? |
Weekly vs monthly PPC reports: what changes
The template stays the same; the depth and focus shift.
Weekly reports are operational. Keep them short: a scorecard against last week, pacing, the biggest movers and anything that broke (a disapproved ad, a tracking drop, a sudden CPA spike). The goal is early detection, so you can act before a bad week becomes a bad month.
Monthly PPC reports are strategic. Compare against the previous month and the target, and against the same month last year if you have seasonality. This is where the ecommerce outcome, platform mix, creative learnings and next month's plan belong. A monthly report should end with decisions: budget shifts, tests to launch, campaigns to retire.
Many teams combine both: an automated weekly digest that keeps everyone informed, plus a monthly report with human commentary. That split works well for weekly executive summaries in particular.
KPIs by business type: ecommerce vs lead gen
Ecommerce
- Revenue (store and platform-reported), orders and AOV
- ROAS by platform and blended ROAS or MER
- CPA or cost per purchase, new vs returning customers
- Refunds and the products driving them
- Product-level performance for shopping and catalog campaigns
Lead generation
- Leads and cost per lead
- Qualified leads or SQLs and cost per qualified lead, if your CRM feeds that back
- Lead-to-customer rate and pipeline or revenue influenced
- Conversion rate by landing page
- Lead quality notes from sales
The common thread: report the metric closest to money that you can measure reliably, and treat clicks and CTR as diagnostics rather than results.
Common PPC reporting mistakes
- Leading with vanity metrics. Impressions, clicks and CTR going up says nothing about whether the business benefited. Keep them in the diagnostic layer.
- Reporting platform ROAS only. Each ad platform credits itself, so adding them up usually overstates results. Pair platform numbers with store revenue and blended ROAS.
- No "so what". A chart showing CPA up 18% is data. "CPA rose because the new creative underperformed, and we're rotating it out on Monday" is a report.
- Too long. Thirty slides signal effort, not clarity. If the summary and scorecard don't fit on one page, cut.
- Changing structure every month. Consistency lets readers spot trends. Keep sections and KPI definitions stable.
- Building it by hand. Copying numbers from four platforms into a spreadsheet invites errors and eats hours. See the hidden cost of manual reporting.
How to automate your PPC report with Meerkads
Meerkads connects Google Ads, Meta Ads and TikTok Ads with Shopify, GA4 and Google Search Console, so the data for most sections of this template sits in one place. Here is how the template maps to the product.
Start from ready-made reports
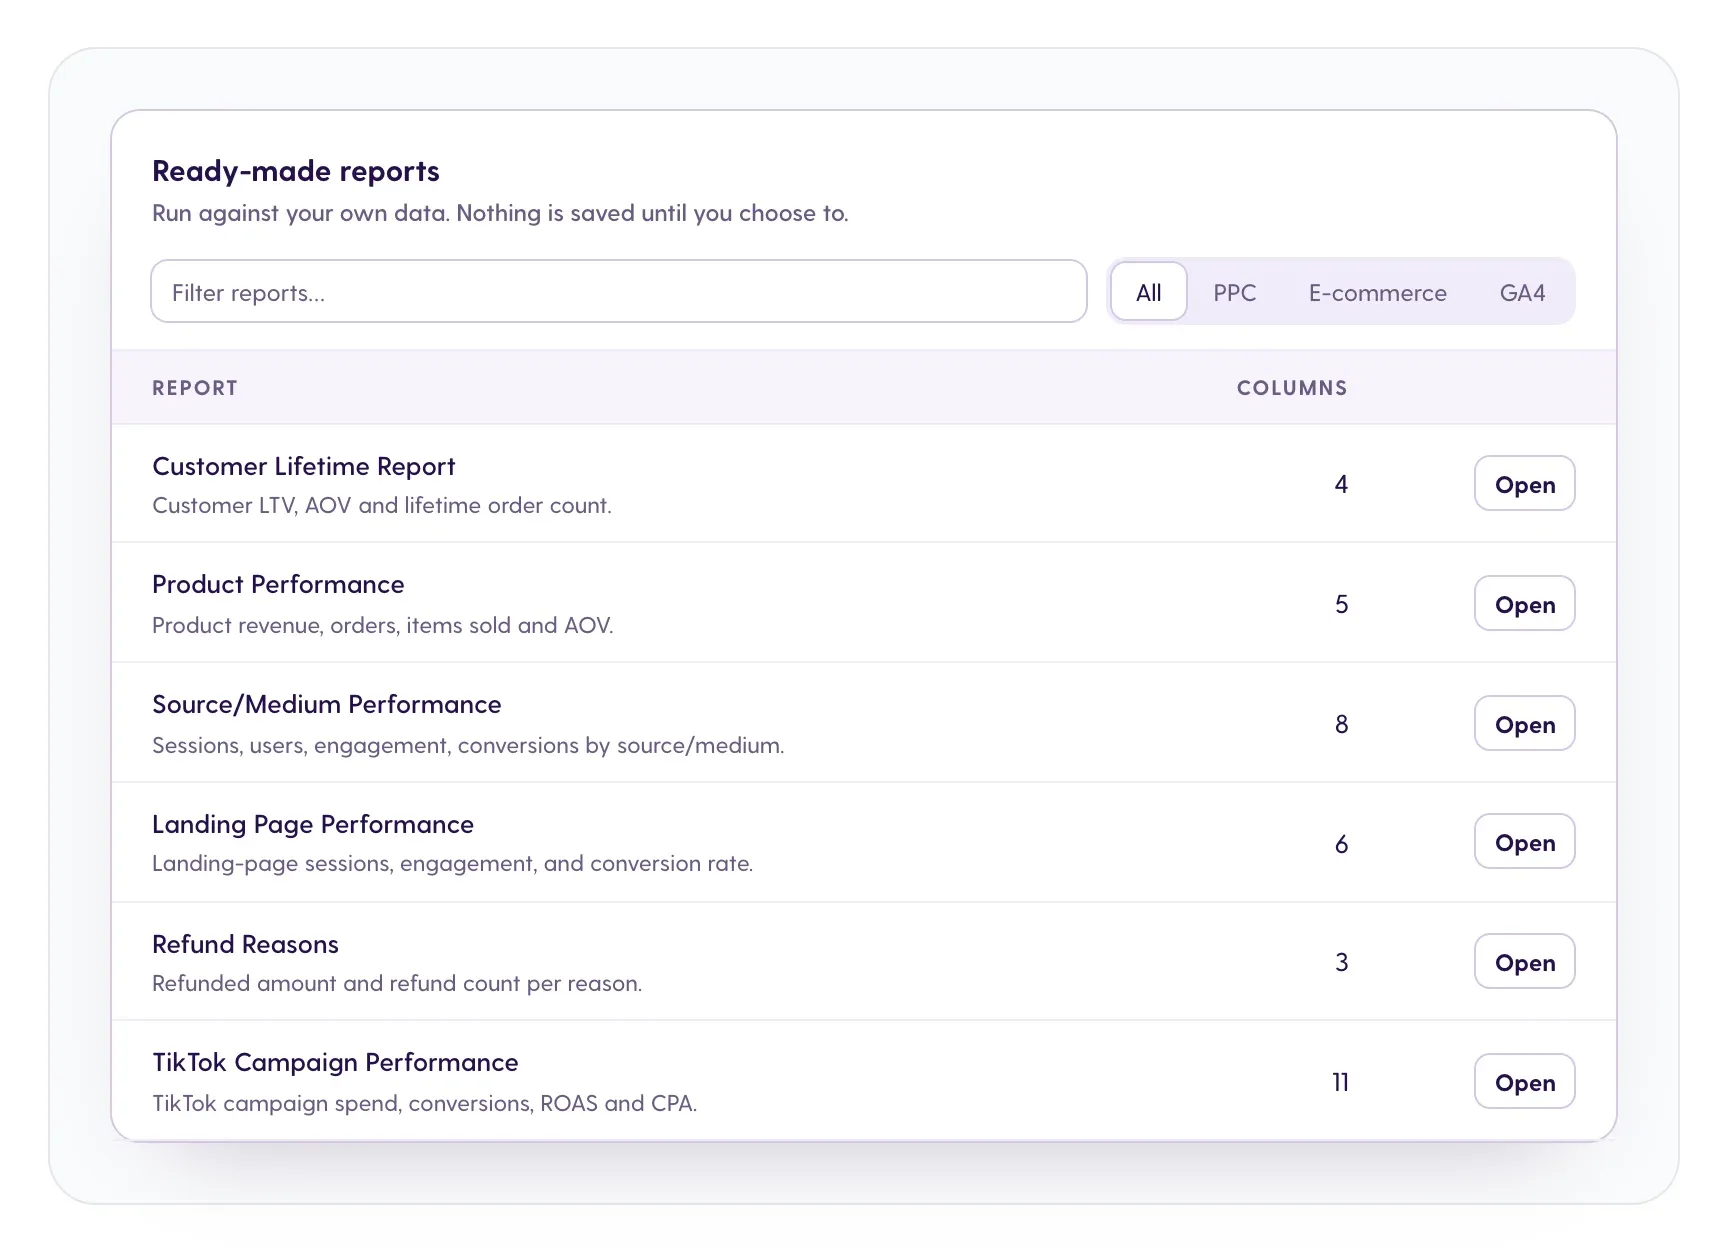
Instead of designing every page, start with ready-made report templates such as Product Performance, Source/Medium, Landing Page, Refund Reasons, Customer Lifetime and TikTok Campaign Performance. You can filter them by PPC, ecommerce or GA4 and build custom reports on top.
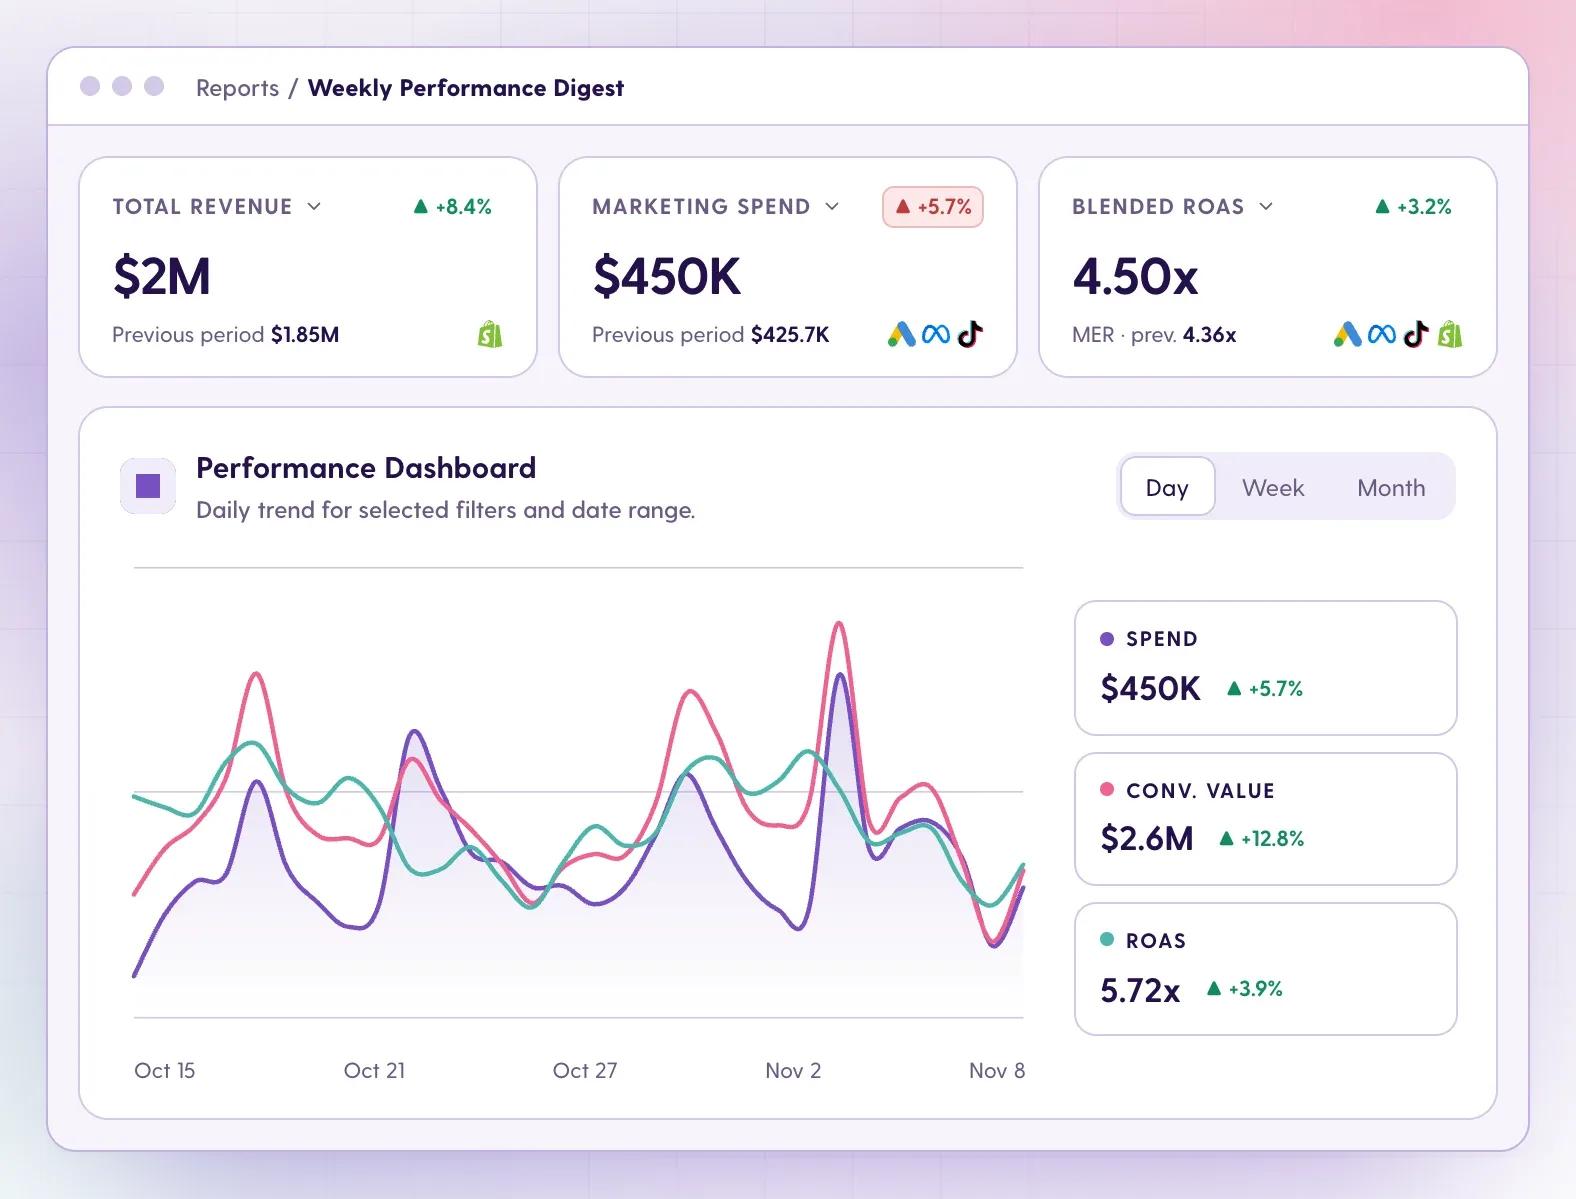
Use the Weekly Performance Digest as your scorecard
The Weekly Performance Digest covers the top of the template: total revenue, marketing spend, blended ROAS with MER and a performance chart. It answers "are we on track?" in one view and works as the weekly report in a weekly-plus-monthly setup.
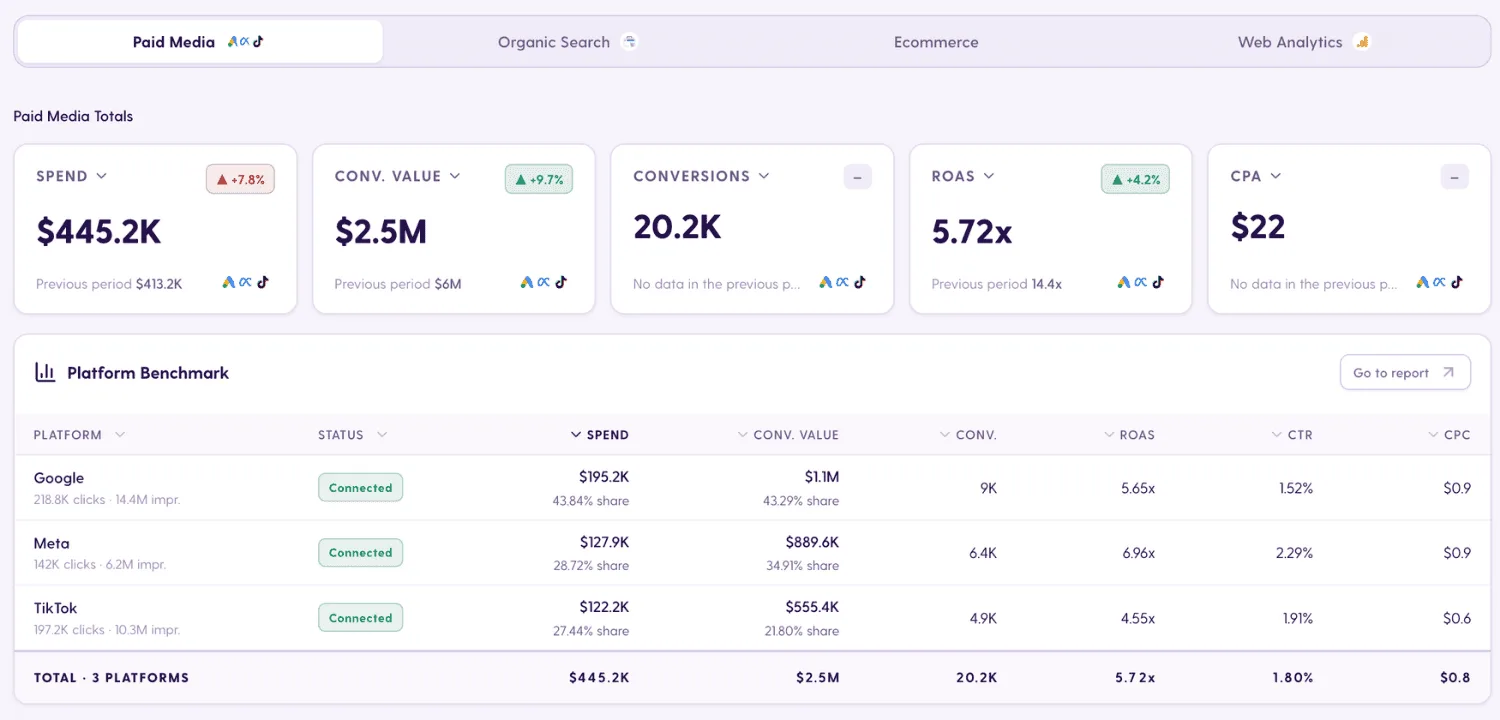
Fill the channel breakdown with the platform benchmark
The platform benchmark shows paid media totals and compares Google, Meta and other platforms side by side, which covers Section 4 without exporting anything.
Schedule delivery, white-label and share
Set reports to send daily, weekly or monthly. With white-label branding, reports carry your logo and colors, and you can deliver a PDF or a live link that clients open without logging in. If you run client reporting for an agency, this is the part that saves the most hours.
Let AI add the "so what"
AI Recommendations analyze performance, explain findings in plain language and attach a suggested next step to each one, with AI performance scoring of campaigns and creatives. Use them as a first draft for Section 9: you review, decide what to apply and add your own context. Pair them with Monitor & Alerts so ROAS drops, CPA spikes or spend overruns reach you between reports.
Manage many clients from one portfolio view
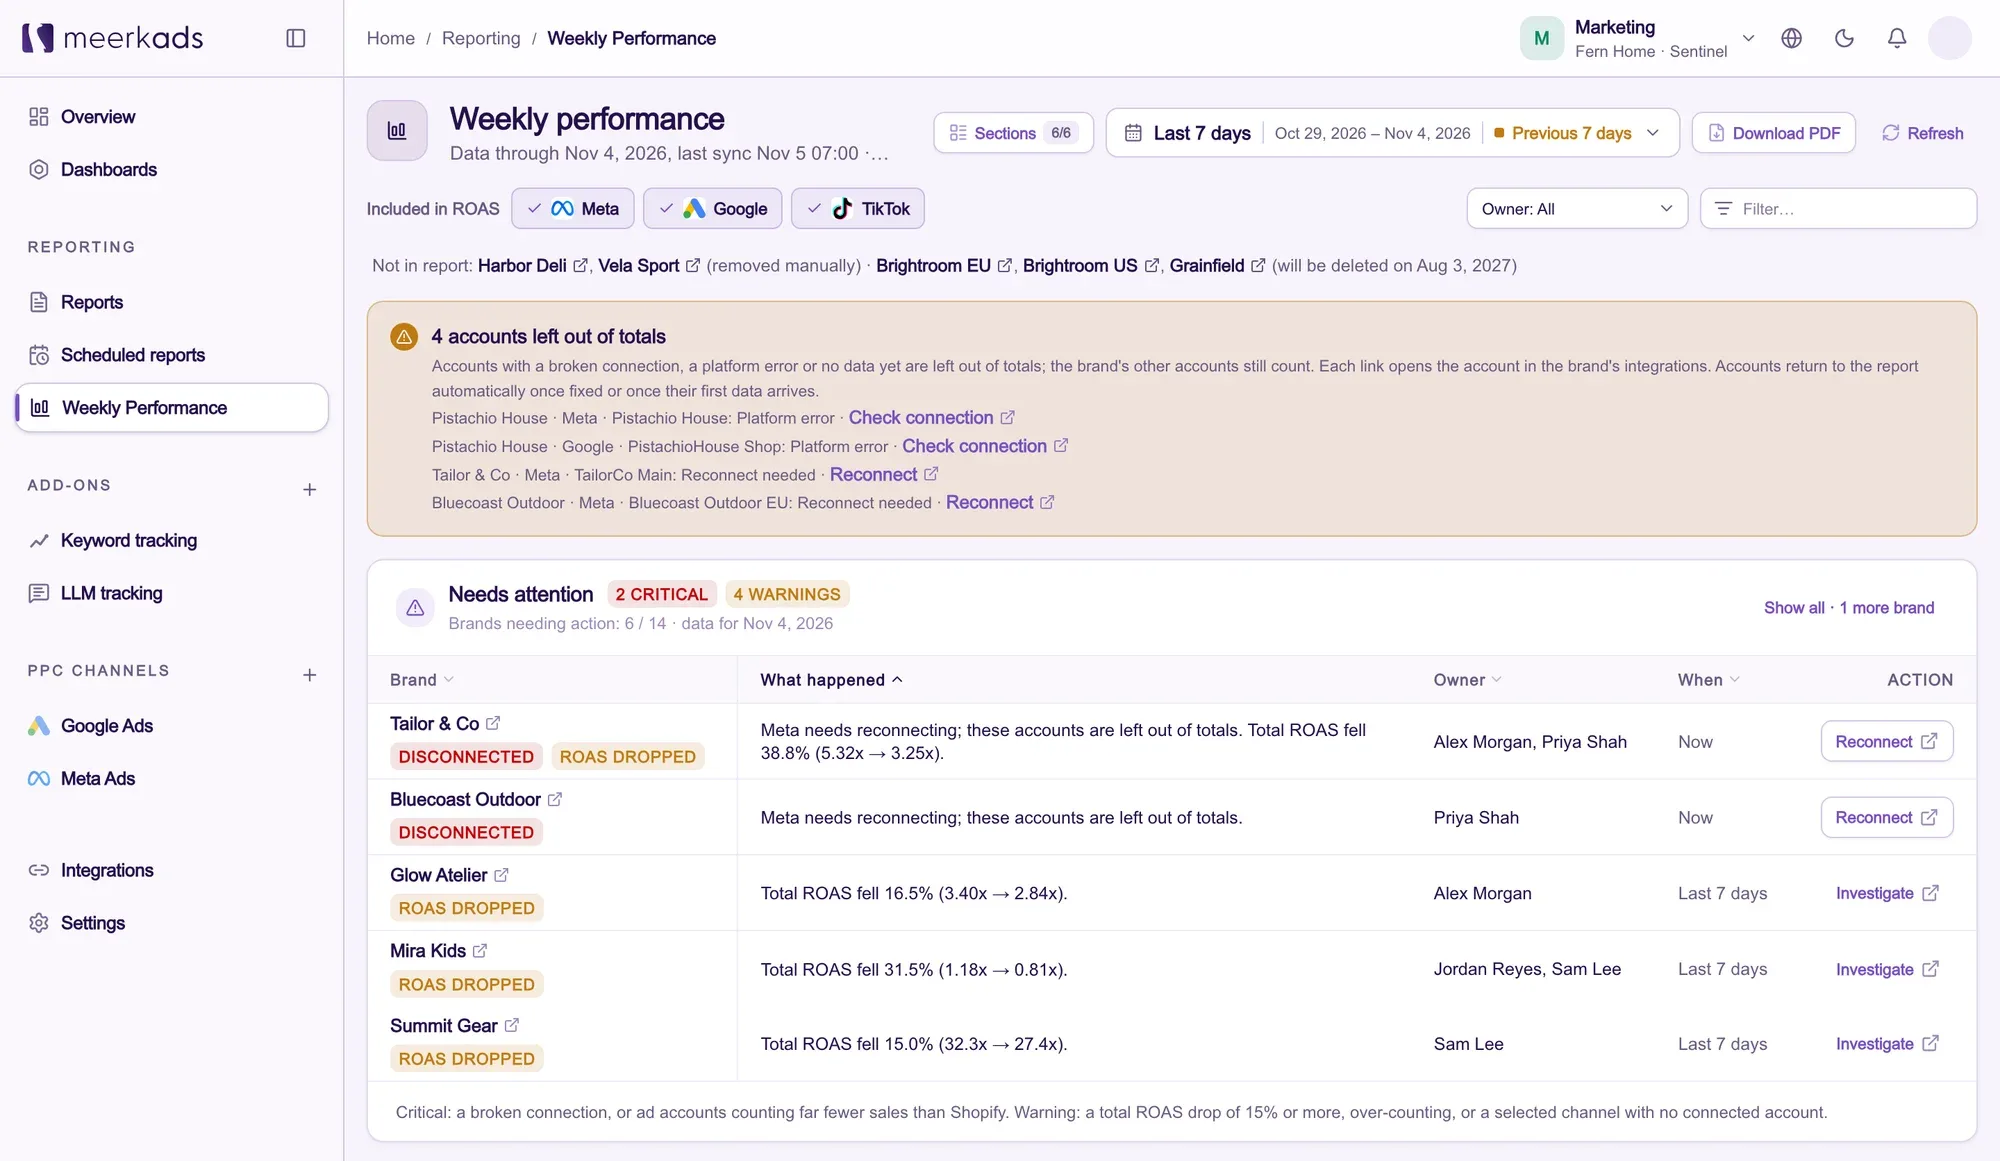
Agencies running PPC for several brands can use the portfolio Weekly performance view. It shows which accounts are left out of totals and why (a broken connection, a platform error, waiting for first data), plus a Needs attention table that flags issues such as a ROAS drop with before and after values. Each brand has an owner, so account managers know which reports need commentary first.
More on that workflow in our guide to Meerkads for agencies. Report automations, white-label dashboards and AI analysis are part of the Sentinel plan; see pricing for details.
FAQ
What should a PPC report include?
At minimum: an executive summary, a KPI scorecard against the previous period and target, spend and pacing, a platform breakdown, campaign performance, top and bottom ads, and insights with next steps. Ecommerce brands should add store revenue, blended ROAS and refunds so the report reflects real business results, not only platform-reported numbers.
How often should I send a PPC client report?
Most teams send a short weekly update and a fuller monthly PPC report. The weekly version focuses on pacing and anomalies; the monthly version covers strategy, creative learnings and next month's plan. Automated scheduled delivery makes it realistic to do both without extra work.
Is a Google Ads report template enough if I also run Meta and TikTok?
No. A Google Ads report template only shows one platform's view, and each platform credits itself for conversions. If you run several channels, report them side by side and compare total ad spend against store revenue to get blended ROAS.
How long should a PPC report be?
The summary and scorecard should fit on one page. Supporting sections can follow, and detailed tables belong in an appendix. If readers can't find the headline result and the next actions within a minute, the report is too long.
Turn the template into a report that builds itself
A PPC report template is only useful if you keep using it. If you're tired of rebuilding the same report every week, try Meerkads free for 7 days: connect your ad accounts and store, pick a ready-made report, schedule it with your branding, and let AI draft the "so what" for you to review.
Damla Teoman Avcıbaşı · Sales & Marketing LeadDamla Teoman Avcıbaşı is the Sales & Marketing Lead at Meerkads. Writes about AI in marketing, marketing tools and growth.