E-Commerce
Shopify Analytics: The Metrics That Matter and How to Act on Them
Shopify tells you what happened in your store, but not always why or whether it was profitable. Here is how to read the metrics that matter and build a dashboard that answers both.
 Kardelen Yalduz · 9 min read
Summarize with AI
Contents 7 sections
Most Shopify stores don't have a data problem. They have a reading problem. The numbers are there every morning: sales, orders, sessions, a conversion rate. What's missing is a clear answer to the questions you actually care about. Did last week go well because more people bought, or because a few people bought more? Is that revenue profitable once ad spend and refunds come out? Which products will sell out before your next restock lands?
This guide covers what Shopify analytics should tell you, the metrics worth tracking, where store data stops being enough, and how to build a dashboard and weekly routine that turns those numbers into decisions.
What Shopify analytics should actually tell you
Shopify gives every store built-in analytics: an overview of sales and orders, plus reports on things like sales over time, customers, products and store traffic. How deep those reports go depends on your plan and setup, but the core is always the same. Your store records every order, every customer and every refund, so it is the most reliable source you have for what actually happened at the till.
Good Shopify analytics should answer four questions, in this order:
- How much did we sell, and why did it change? Revenue is the headline, but you need to know whether the change came from more orders, a higher order value, or a better conversion rate.
- How much of that revenue did we keep? Refunds, discounts and cost of goods all eat into the top line.
- Who is buying? A store growing on returning customers behaves very differently from one that depends on a steady flow of new buyers from paid ads.
- Can we keep selling? Stock levels and checkout friction decide whether demand turns into orders tomorrow.
If your dashboard can't answer those four questions in a couple of minutes, it is a wall of charts, not a dashboard.
The Shopify metrics that matter
You can track dozens of Shopify metrics. These eight cover most of the decisions a growth team makes week to week.
| Metric | What it tells you | Watch out for |
|---|---|---|
| Sales revenue | Total value of orders in the period, your headline growth number | Gross vs net: discounts, refunds and returns can make two revenue figures disagree |
| Orders | How many purchases happened, separate from how much they were worth | A revenue rise with flat orders usually means price or mix changed, not demand |
| Average order value (AOV) | Revenue divided by orders, a read on bundling, upsells and pricing | A few large orders can inflate it; compare against the median when you can |
| Conversion rate | Share of sessions that ended in a purchase | Traffic quality swings it; a paid campaign with weak targeting can drag it down without anything being wrong on site |
| Refunds and refund rate | Revenue you gave back and how often it happens | Refunds often land weeks after the order, so recent periods look better than they are |
| Abandoned checkout rate | Share of started checkouts that didn't complete | Shipping costs, payment options and surprise fees are common culprits; look at revenue at risk, not just the rate |
| New vs returning orders | Whether growth comes from acquisition or retention | A rising returning share can hide that new customer acquisition is slowing |
| Stock coverage | How many days current inventory lasts at the current sales pace | Best sellers run out first; a stockout on a hero product can look like a marketing problem |
Read these together, not one at a time. A drop in conversion rate during a week when abandoned checkouts spiked points to the checkout. The same drop during a week when new orders surged and returning orders were flat points to colder paid traffic.
Where Shopify's numbers stop
Your store knows everything that happens after someone lands on your site. It knows very little about what it cost to get them there.
Ad spend lives in Google Ads, Meta Ads and TikTok Ads. Each platform also reports its own conversions and its own ROAS, based on its own attribution rules. That creates two problems for anyone trying to judge profitability:
- Store revenue doesn't include cost. A record sales week means little if you spent more than usual to get it. Profitability needs revenue from Shopify and spend from the ad platforms, side by side.
- Platform-reported revenue doesn't match the store. When Meta, Google and TikTok each take credit for the same order, the sum of their reported revenue can be higher than what Shopify actually recorded. We cover the reasons in detail in why your Meta Ads dashboard and Shopify revenue never match.
The practical fix is to keep both views. Use platform ROAS to compare campaigns inside a single channel, and use store revenue divided by total ad spend (blended ROAS, sometimes called MER) to judge whether the business as a whole is spending well. If you also subtract refunds and cost of goods, you get much closer to what we call true ROAS. For a step-by-step method, see how to connect ad spend to actual store revenue.
This is where most Shopify analytics setups break down: the store data is in one tab, the ad data is in three others, and someone rebuilds the comparison in a spreadsheet every Monday.
Walking through a Shopify analytics dashboard in Meerkads
Meerkads connects your Shopify store alongside Google Ads, Meta Ads, TikTok Ads, GA4 and Google Search Console, so store results and ad spend sit in one place. The Shopify dashboard is organized around the four questions above. Here is how each screen works.
Command Center: the one-screen health check
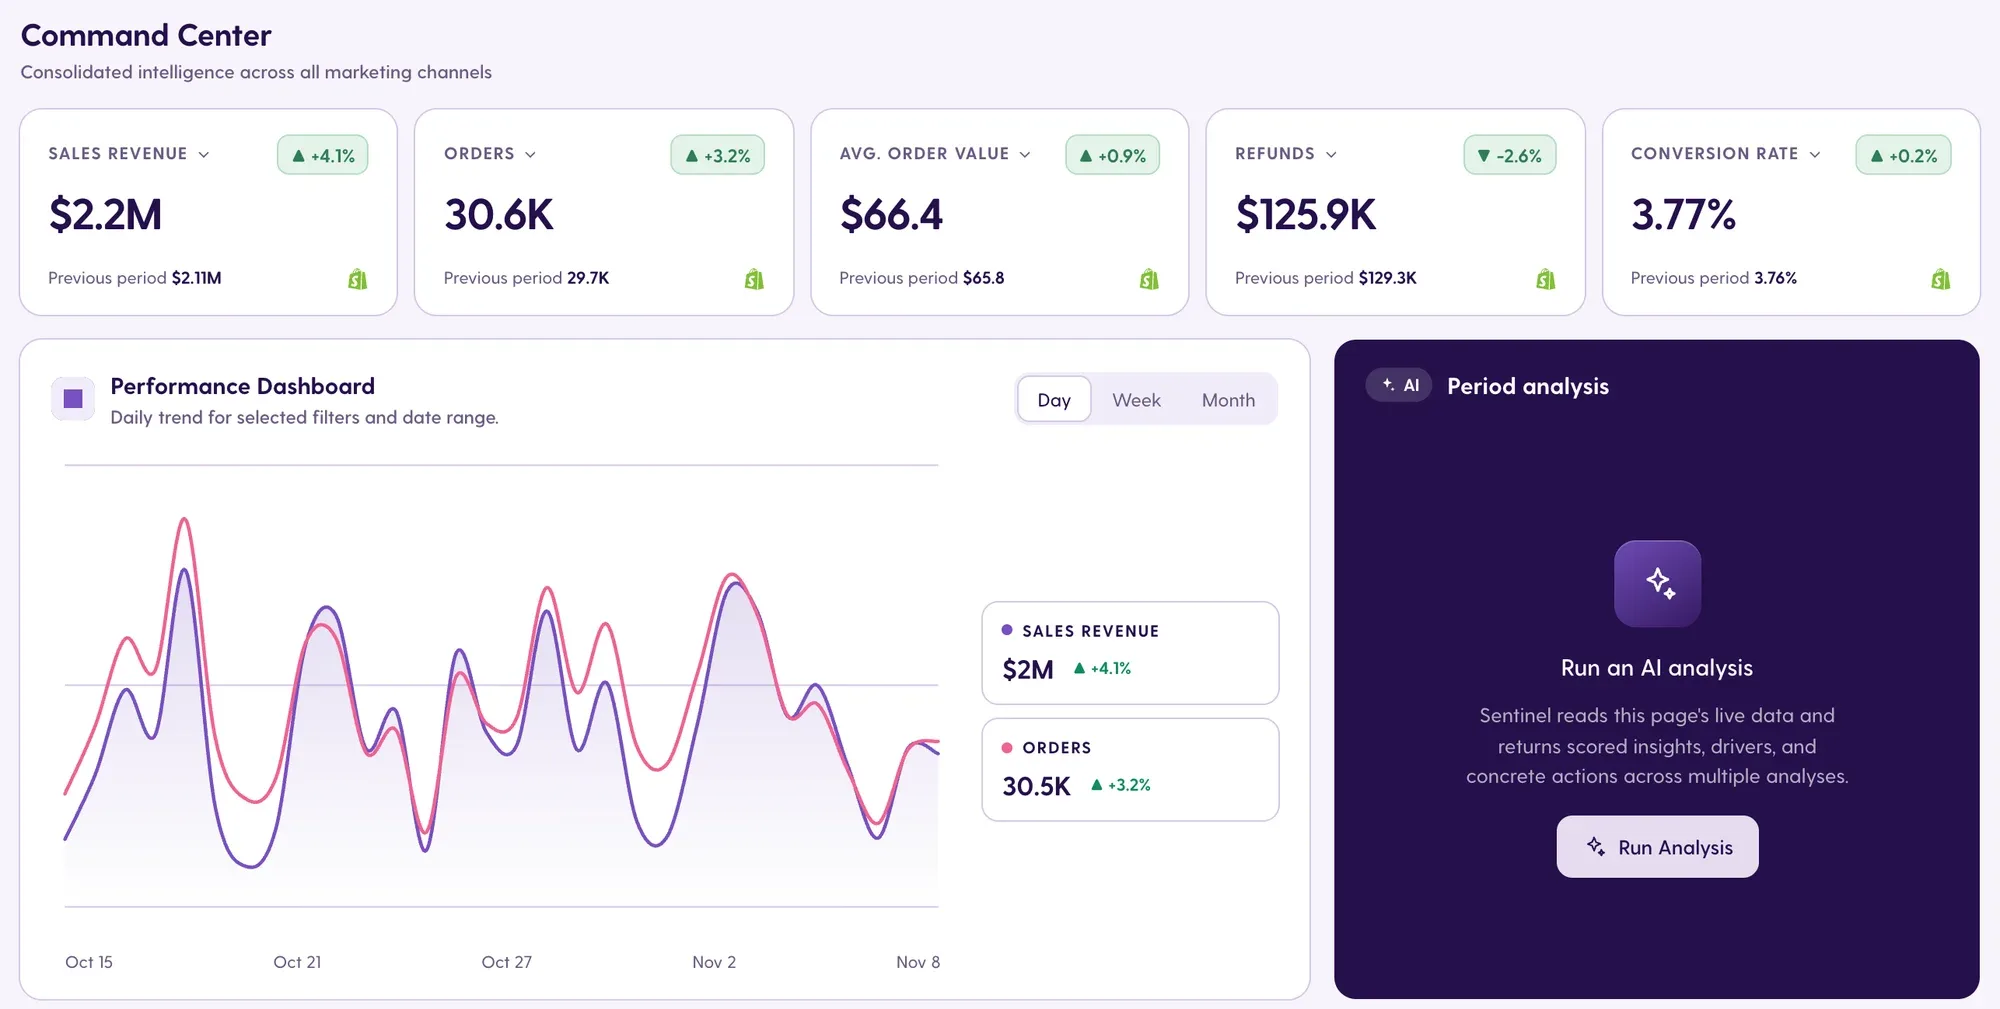
The top row shows sales revenue, orders, AOV, refunds and conversion rate for the selected period, each compared with the previous one. Below it, a performance chart shows how those numbers moved day by day, which helps you spot whether a change was a single spike or a steady trend.
Next to the chart is the Period analysis card. It reads the live data on the page and returns scored insights, the drivers behind the change and suggested actions. If revenue rose but AOV fell, it tells you that in plain language instead of leaving you to work it out across five cards.
Abandoned checkouts and new vs returning customers
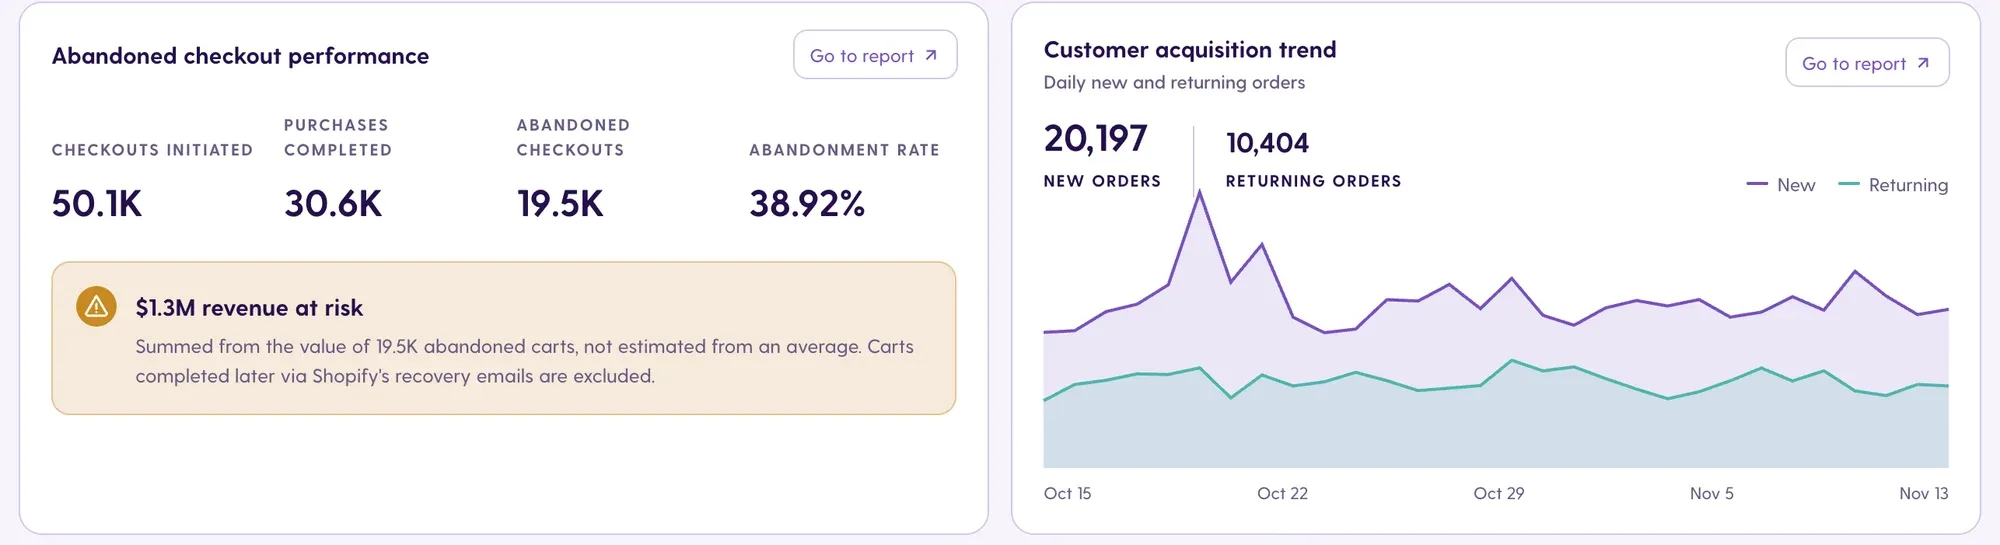
The abandoned checkout panel shows checkouts initiated, purchases completed, the abandonment rate and revenue at risk. Revenue at risk is the number to bring to your team: it turns an abstract percentage into money you can try to recover with checkout fixes or recovery emails.
The customer acquisition trend splits orders into new and returning over time. If you are scaling paid campaigns, this is where you check that spend is actually bringing in new buyers. If the returning line carries the store while the new line flattens, your acquisition engine needs attention even if total revenue looks fine.
Refunds by reason and product
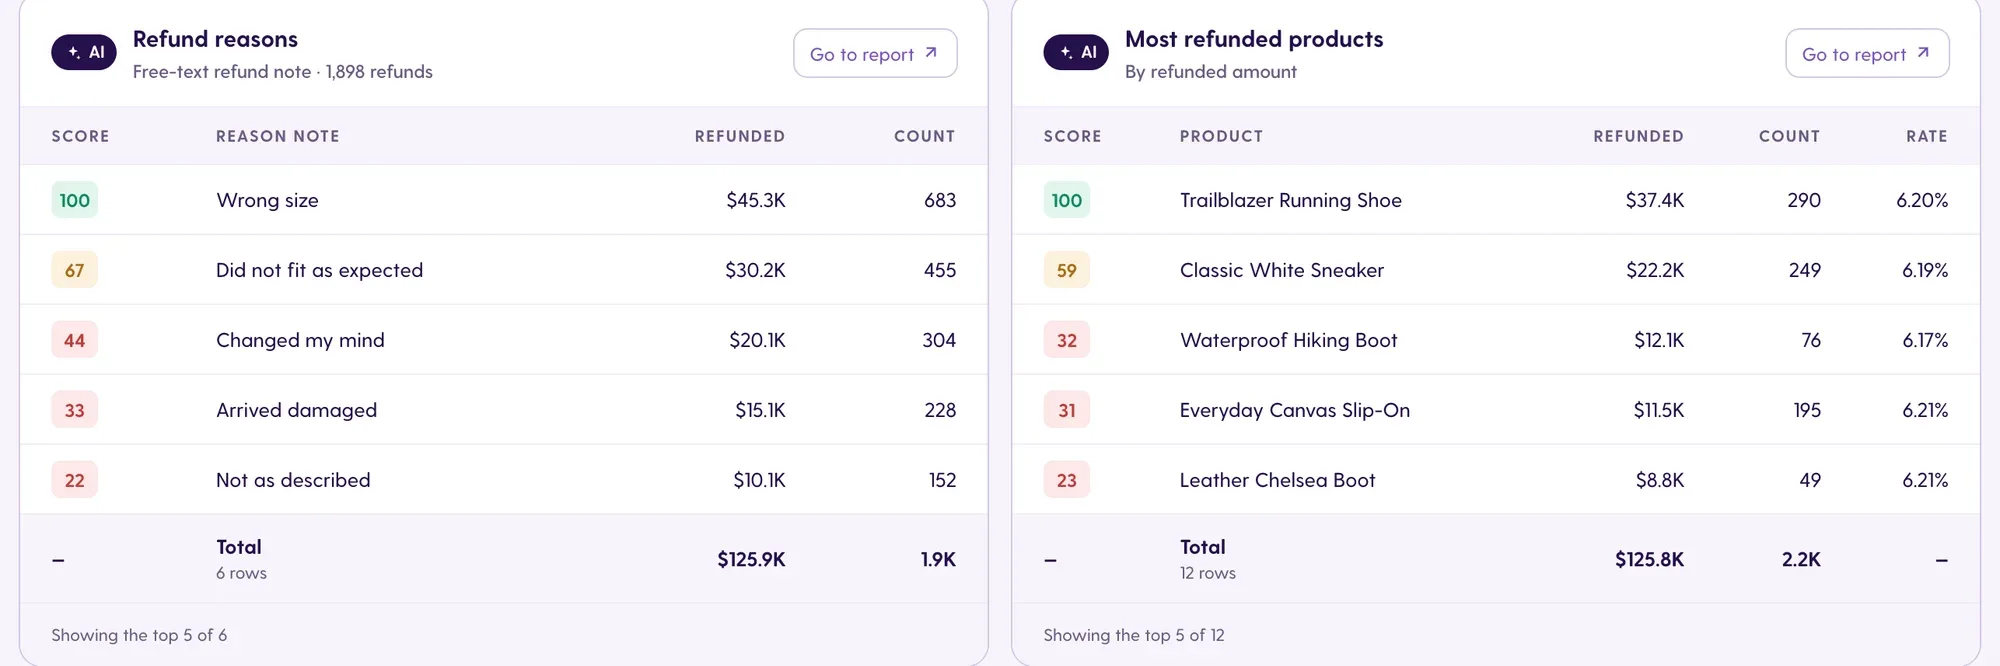
Refunds are one of the most under-read areas of Shopify analytics. Meerkads shows the refund trend, the reasons behind refunds and the most refunded products, each with an AI score that flags where the problem is concentrated.
A cluster of "wrong size" refunds on one product is a sizing chart problem. A cluster of "not as described" refunds is often an ad or product page problem: the creative promised something the product doesn't deliver. Either way, every refund on a product you are actively advertising is ad spend you paid twice for. The ready-made Refund Reasons report lets you send this to your team or client on a schedule.
Product turnover and stock coverage
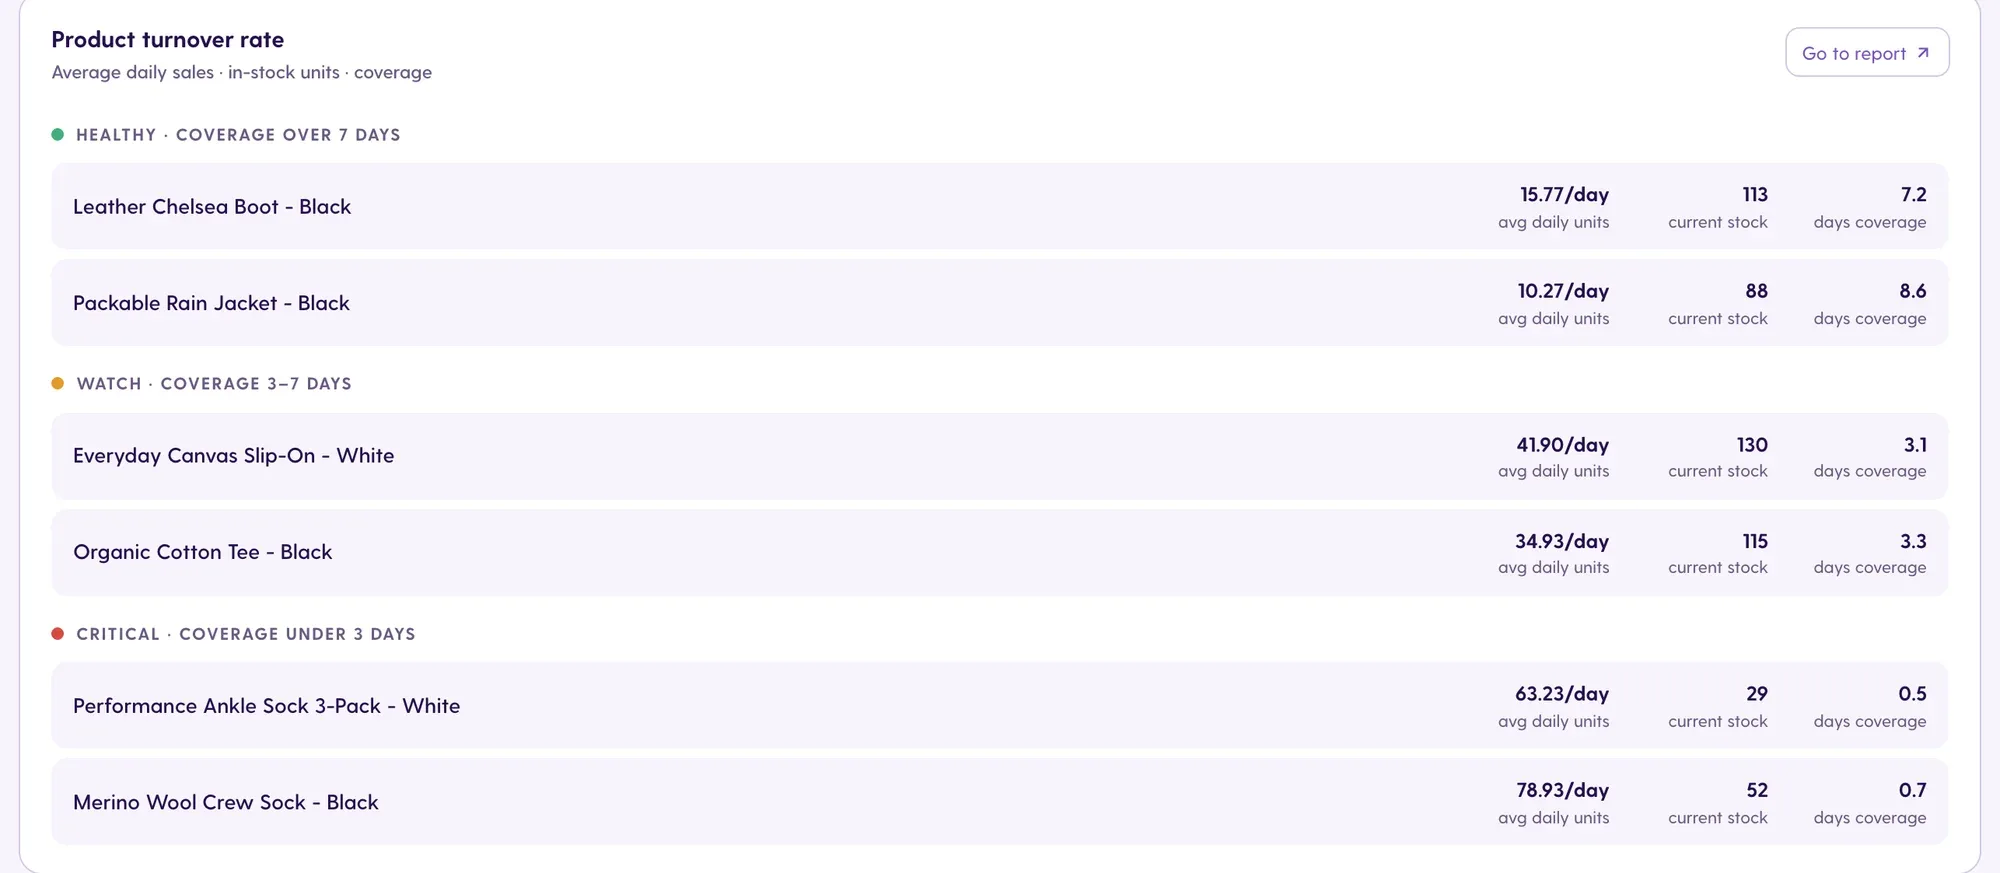
Stock coverage estimates how many days of inventory each product has left at its current sales pace, and labels it healthy, watch or critical. This is the screen that keeps marketing and operations from working against each other.
If a product is in the critical band, scaling its ads will only bring stockouts and disappointed customers faster. If a product sits in healthy coverage with slow turnover, it may be a candidate for a promotion or more budget. Pair this with the best and worst selling products view, which also carries AI scores, to decide where the next dollar of ad spend should go.
Turning Shopify metrics into actions
A dashboard earns its place when it shortens the gap between "something changed" and "here's what we're doing about it". Three habits make the biggest difference.
Start with the AI period analysis, then verify. Read the scored insights and drivers first, then check the cards and charts that support them. You stay in charge of the decision; the analysis just gets you to the right question faster. The same approach runs across ad accounts in AI Recommendations, where each finding comes with a suggested next step.
Treat refund reasons as feedback on your marketing. When the most refunded products overlap with your top-spending campaigns, review the creative and landing page before raising budgets. Fixing the promise often lowers refunds and improves ROAS at the same time.
Let alerts watch stock and spend for you. With Monitor & Alerts you can set thresholds such as ROAS floors, CPA ceilings, spend limits and conversion drops, so you hear about problems before the weekly review. Combine that with stock coverage: when a product moves into critical coverage, check which campaigns are pushing it and adjust.
To see how store revenue lines up against marketing spend over time, the ecommerce vs marketing performance view puts revenue, spend and blended ROAS on one page.
A weekly Shopify analytics routine
You don't need to check everything every day. A focused 20 to 30 minute weekly review covers most of what matters. Here is the routine I recommend:
- Open the Command Center and compare to last week. Note which of revenue, orders, AOV and conversion rate moved, and in which direction.
- Read the Period analysis card. Write down the top driver and the suggested action you agree with.
- Check blended ROAS against store revenue. Compare it with what the ad platforms reported. A widening gap is a signal to look at attribution or tracking, not just budgets.
- Review abandoned checkouts. Has revenue at risk grown? If so, check recent changes to shipping, payment or checkout settings.
- Look at new vs returning orders. Confirm paid campaigns are still bringing in new customers.
- Scan refunds by reason and product. Flag any product whose refund share is rising, especially if it is heavily advertised.
- Check stock coverage. Move critical products into a restock conversation and pull back ads where needed.
- Agree on one or two actions. A short list of changes you will actually make beats a long list of observations.
If you report to a founder, a leadership team or clients, schedule the summary instead of building it by hand. Meerkads dashboards can be shared as read-only links, and reports can be delivered daily, weekly or monthly.
FAQ
What is Shopify analytics?
Shopify analytics is the data your store collects about sales, orders, customers, products and traffic, along with the reports and dashboards that summarize it. It tells you what happened in your store. To judge profitability, you also need ad spend from platforms like Google, Meta and TikTok.
Which Shopify metrics should I track first?
Start with sales revenue, orders, average order value and conversion rate, since together they explain most revenue changes. Then add refund rate, abandoned checkout rate, new vs returning orders and stock coverage to understand how much revenue you keep and whether you can keep selling.
Why doesn't my Shopify revenue match what my ad platforms report?
Each ad platform attributes conversions with its own rules and time windows, and several platforms can claim the same order. Shopify records each order once. That's why it helps to compare platform-reported ROAS with blended ROAS based on actual store revenue.
Do I need a separate Shopify analytics dashboard?
Shopify's built-in reports are a good starting point for store data. A separate dashboard becomes useful when you want store results and ad spend in one view, AI analysis of what changed, alerts on thresholds, and reports you can share with your team or clients without rebuilding them each week.
If you want to see your own store this way, Meerkads for ecommerce brands connects Shopify with your ad accounts in a few minutes. You can try it with a 7-day free trial and cancel anytime; plans are on the pricing page.
Kardelen Yalduz · Growth Marketing SpecialistKardelen Yalduz is a Growth Marketing Specialist at Meerkads. Writes about agency reporting, performance marketing and growth.