Agencies
Agency Dashboard: How to Monitor Every Client Account in One View
An agency dashboard shows every client, platform and account manager on one screen, with problems first. Here is what it should include, a 15-minute weekly routine, and how to choose agency reporting software.
 Kardelen Yalduz · 9 min read
Summarize with AI
Contents 8 sections
It is Monday morning. Your agency runs ads for 14 brands across Meta, Google and TikTok, and four account managers share them. Somewhere in that portfolio a pixel stopped firing on Friday, one client's ROAS fell by a third, and a Meta connection expired over the weekend. The question is not whether something went wrong. It is how long it takes you to find out, and whether you find out before the client does.
That is the job of an agency dashboard. This guide explains what an agency dashboard is, how it differs from the reports you send to clients, what it should show, and how to use it in a weekly routine. We will use the new agency view in Meerkads as a worked example, with every brand and team name replaced by fictional ones.
What is an agency dashboard?
An agency dashboard is a single view of performance across all your clients. Instead of opening each ad account one by one, you see every brand, every platform and every account manager on one screen, with problems at the top.
It answers three questions in minutes:
- What needs attention right now? Broken connections, sudden drops, tracking problems.
- How is each client performing? By platform and in total, compared with the previous period.
- How is the team doing? Which account manager's portfolio is improving, and whose needs help.
Agency dashboard vs client reports
Agencies often treat these as the same thing. They are not, and mixing them up is why many agencies still discover problems from angry client emails.
- Client reports are external. They show one client their own results, usually weekly or monthly, under your brand. Their job is communication and trust. (We covered them in what to look for in white-label reporting.)
- An agency dashboard is internal. It shows your whole portfolio at once, for your team. Its job is operations: catching problems early, prioritising work and keeping quality consistent across account managers.
Good agency reporting software does both from the same data, so what your team sees on Monday matches what the client receives on Tuesday.
What a good agency dashboard should show
Here is what we think belongs on the screen, in the order you should read it. Each section below matches a part of the Meerkads agency view.
1. Problems first, with an owner and an action
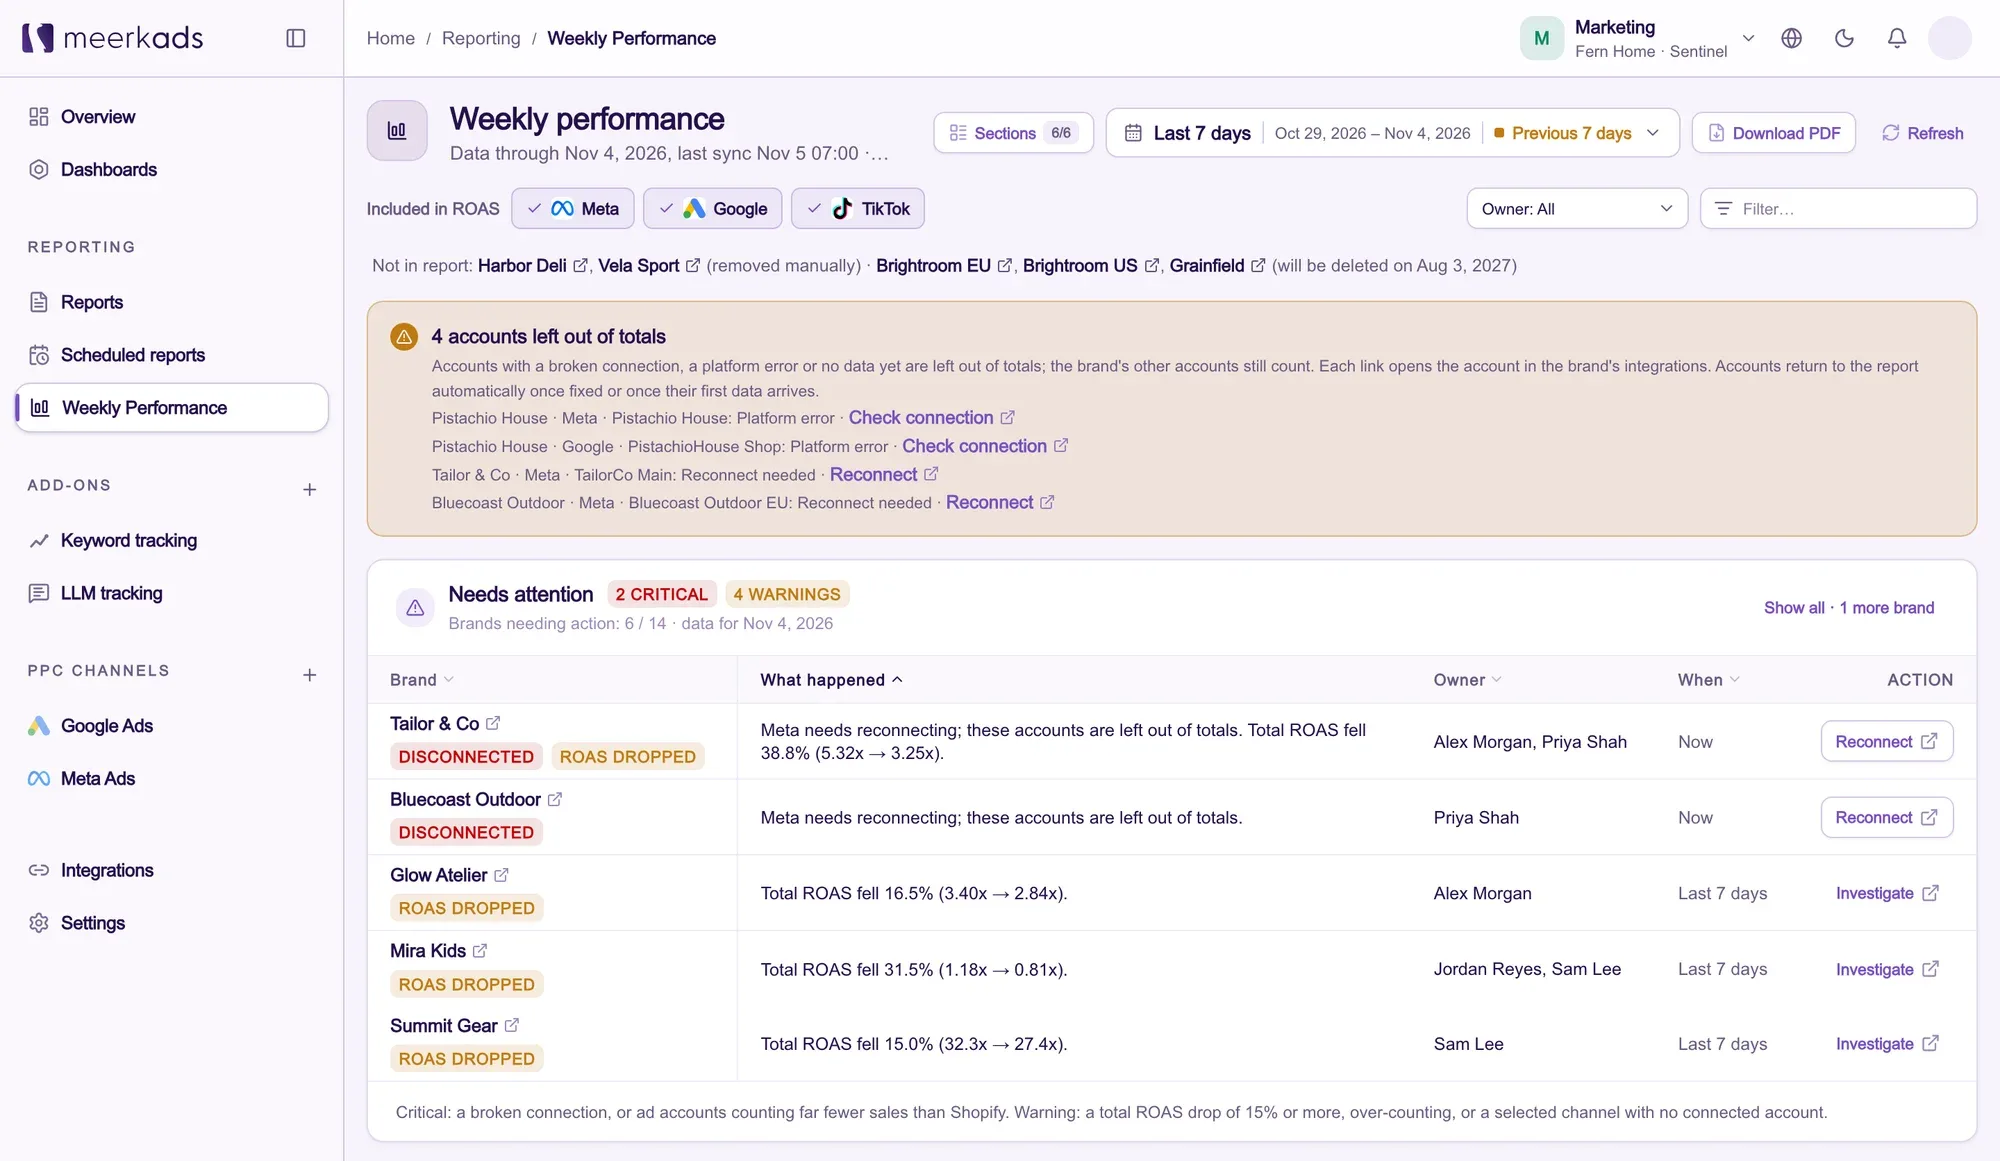
The first thing on the screen should be the list of brands that need action, not a chart. In Meerkads this is the Needs attention table. Every row tells you the brand, what happened, who owns it, when it was detected and what to do next.
Issues are split into two levels so the team knows what to fix first:
- Critical: a broken connection, or ad accounts counting far fewer sales than the store.
- Warning: a total ROAS drop of 15% or more, over-counting, or a channel the brand runs that has no connected account.
The action button matters as much as the alert. "Reconnect" opens the account's integration directly, and "Investigate" opens the brand's detailed view. An alert that does not tell you what to do next tends to be ignored.
2. Data health, stated honestly
Multi-client data is never perfect. Tokens expire, platforms return errors and new accounts take time to load. A dashboard that silently counts a broken account as zero will show a fake ROAS drop and send your team chasing the wrong problem.
The Meerkads view leaves accounts with a broken connection, a platform error or no data yet out of the totals, says so at the top of the page, and links straight to the fix. The brand's other accounts still count, and the account returns to the report automatically once it is fixed. Brands you remove from the report on purpose are listed too, so nobody wonders where a client went.
3. ROAS by brand and platform
The core of an agency dashboard is one table: every brand as a row, every platform as a column, with the change against the previous period.
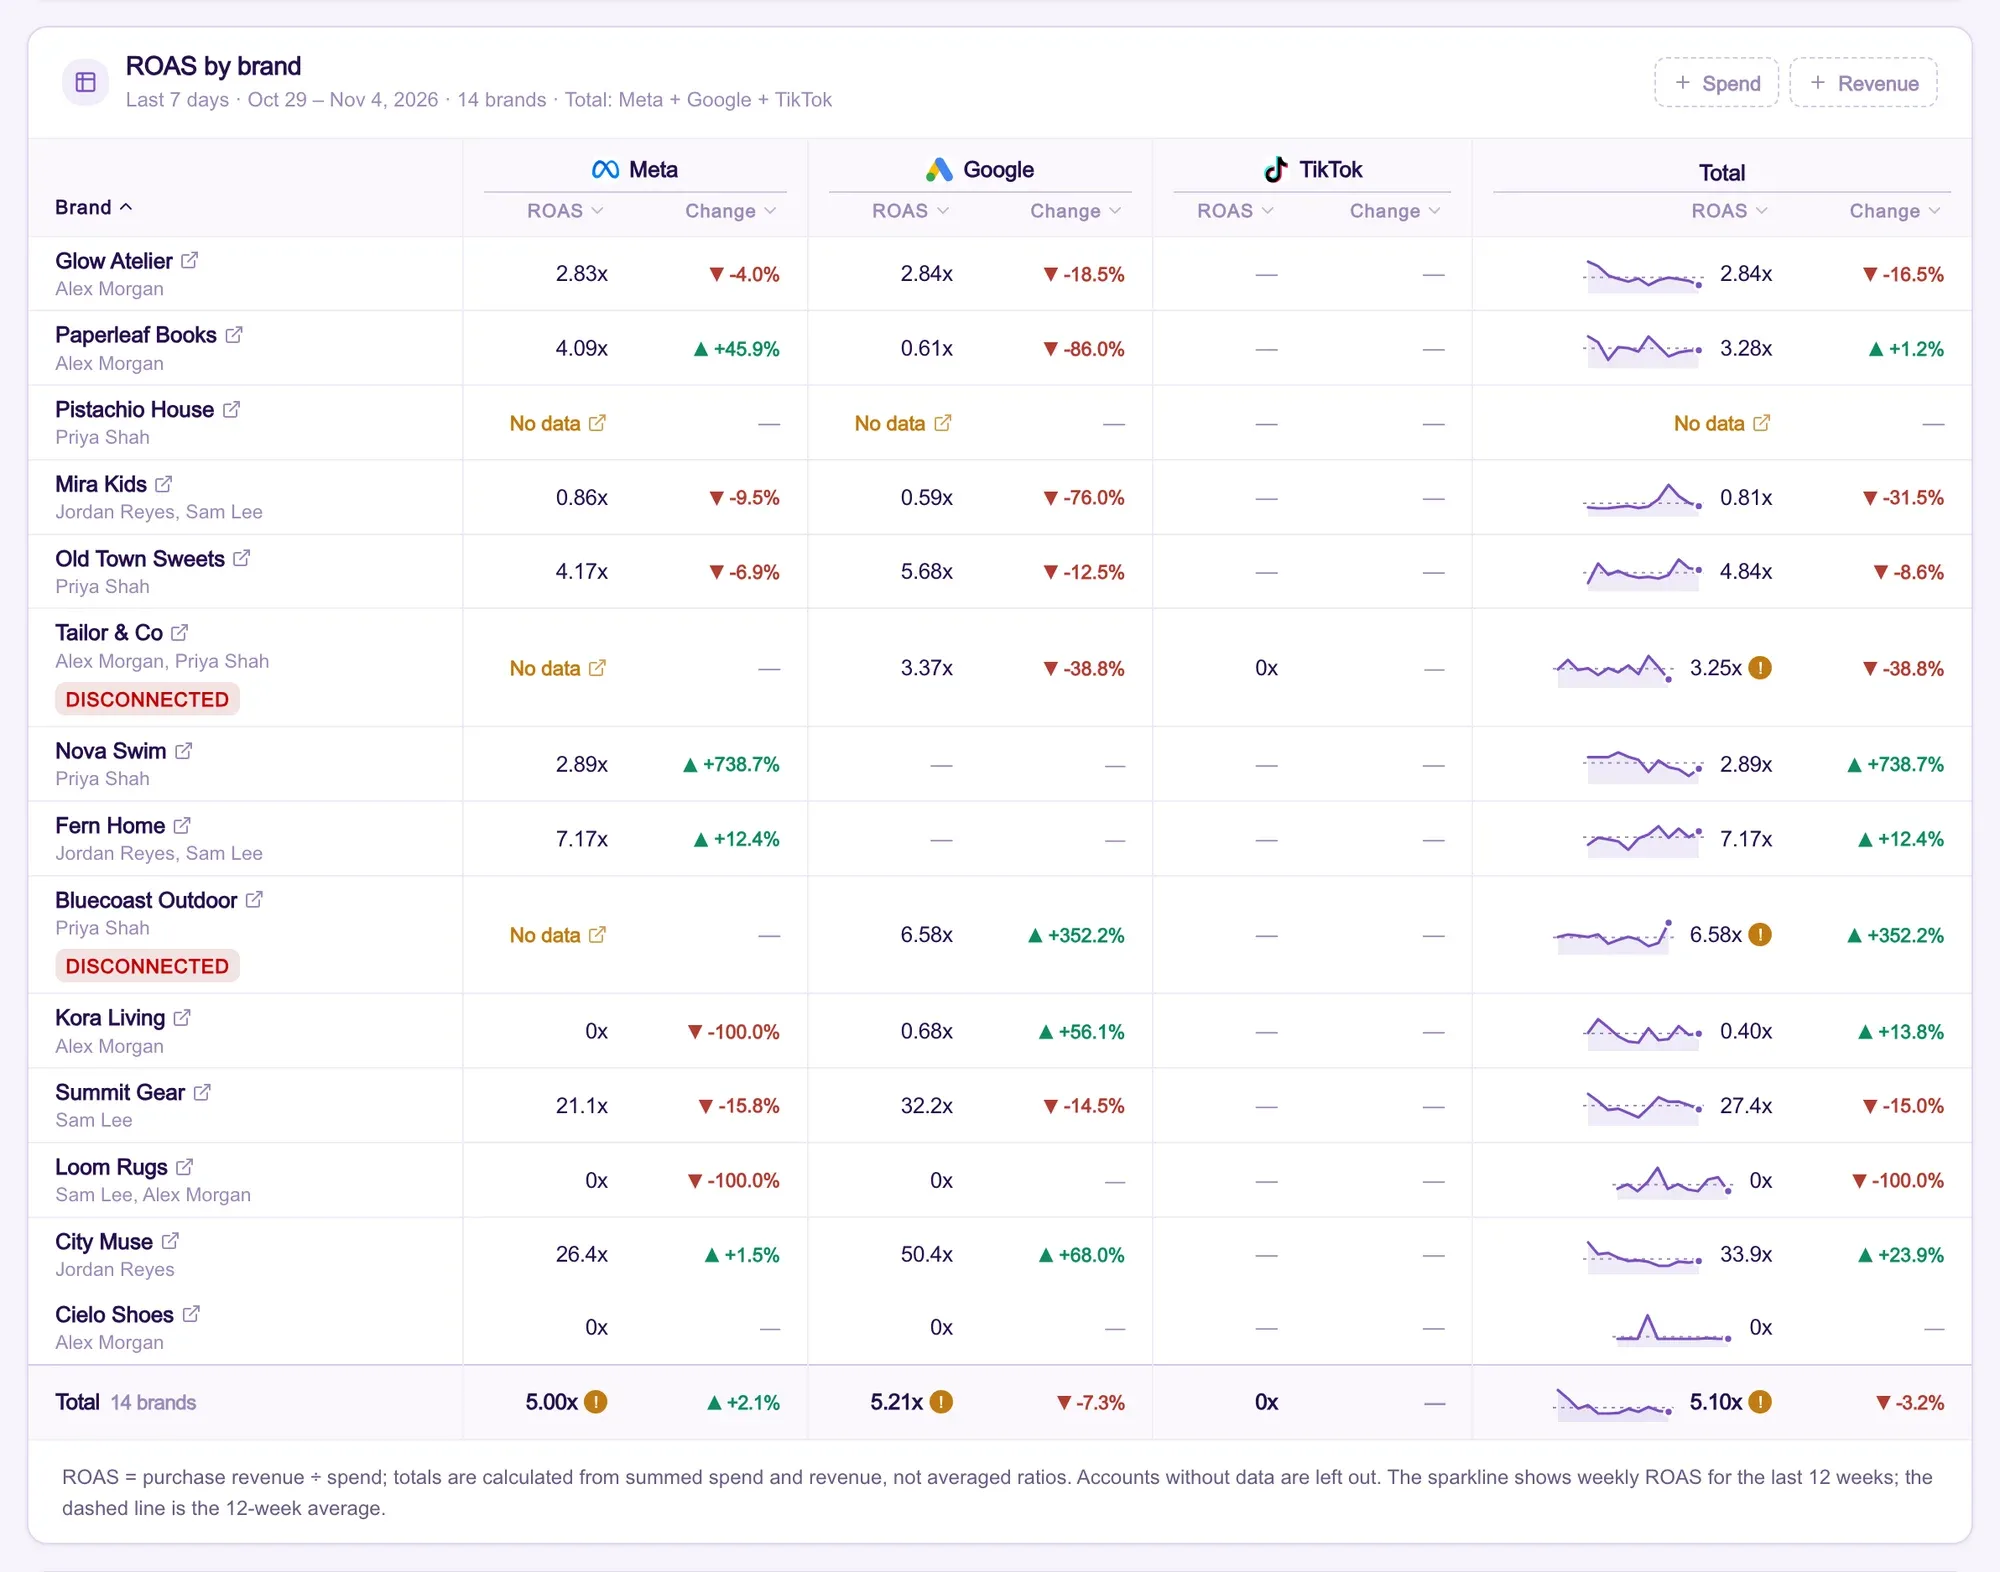
A few details make this table trustworthy:
- Totals are calculated from summed spend and revenue, not averaged ratios. Averaging ROAS across brands or platforms gives a small account the same weight as a large one and produces a number that means nothing.
- Each brand has a 12-week trend line. A 15% drop after three strong weeks is a different story from a 15% drop at the end of a slow decline.
- Owners are shown under each brand. You know immediately who to talk to.
- Spend and revenue are one click away. ROAS alone can hide that a brand spent half as much as last week.
- Currencies are converted consistently. If your clients sell in different currencies, totals only make sense after converting at the same daily rates.
4. Blended ROAS against store revenue
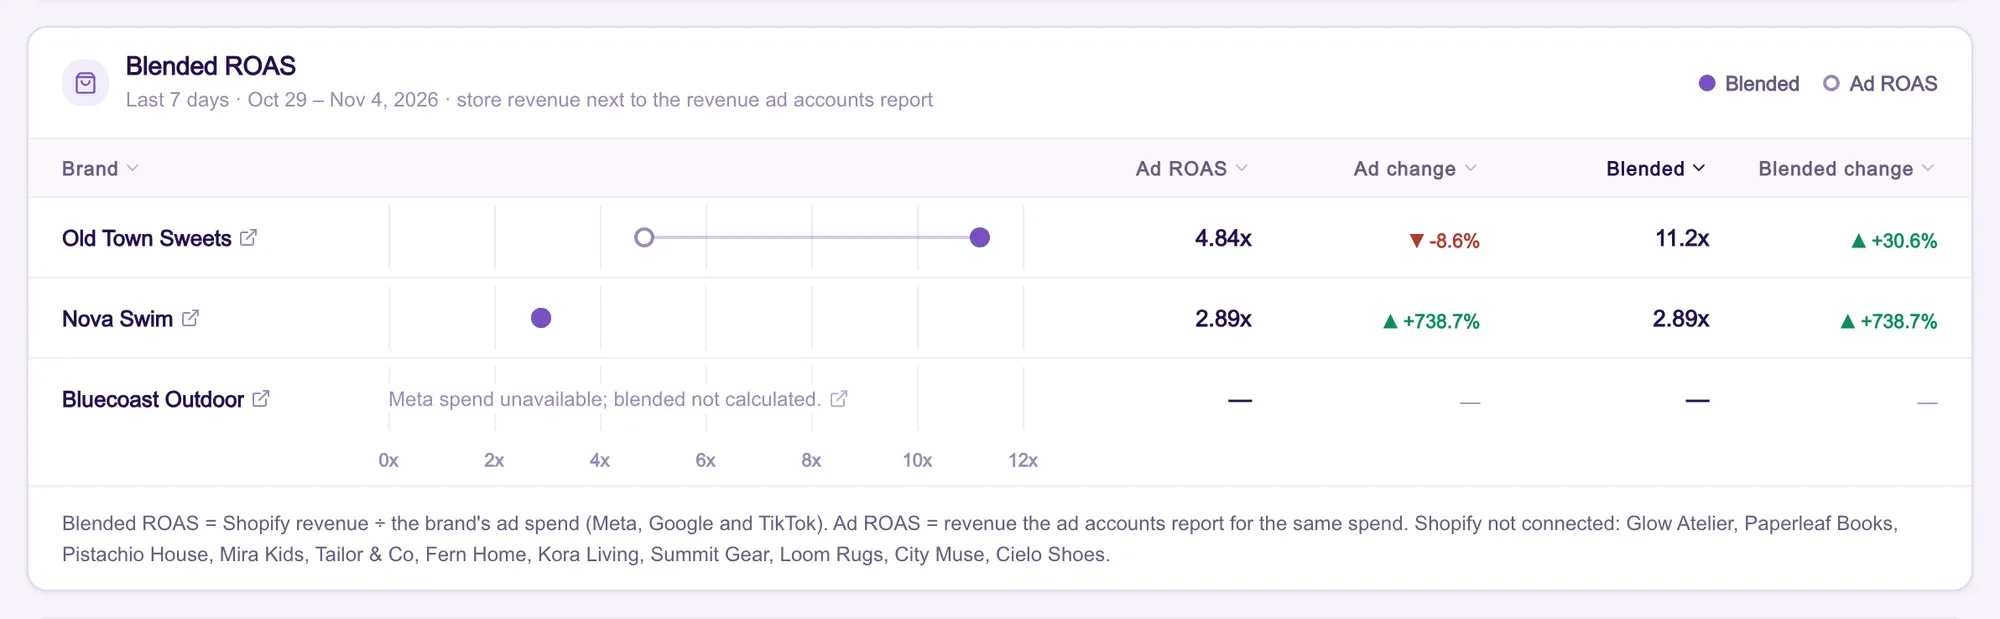
Platform ROAS is what Meta, Google and TikTok report about themselves. Each platform counts conversions with its own attribution rules, and the same sale can be claimed more than once. (Here is why your Meta Ads dashboard and Shopify revenue never match.)
For ecommerce clients, the agency dashboard should put blended ROAS next to platform ROAS: store revenue divided by total ad spend. When the two move in different directions, the platforms are probably over- or under-counting, and that is worth a conversation before you shift budget.
5. Platform share: where the money goes vs where revenue comes from
For each brand, compare each platform's share of spend with its share of reported revenue. If Meta takes 69% of the budget but brings 53% of the revenue, that gap is a budget question you should raise proactively.
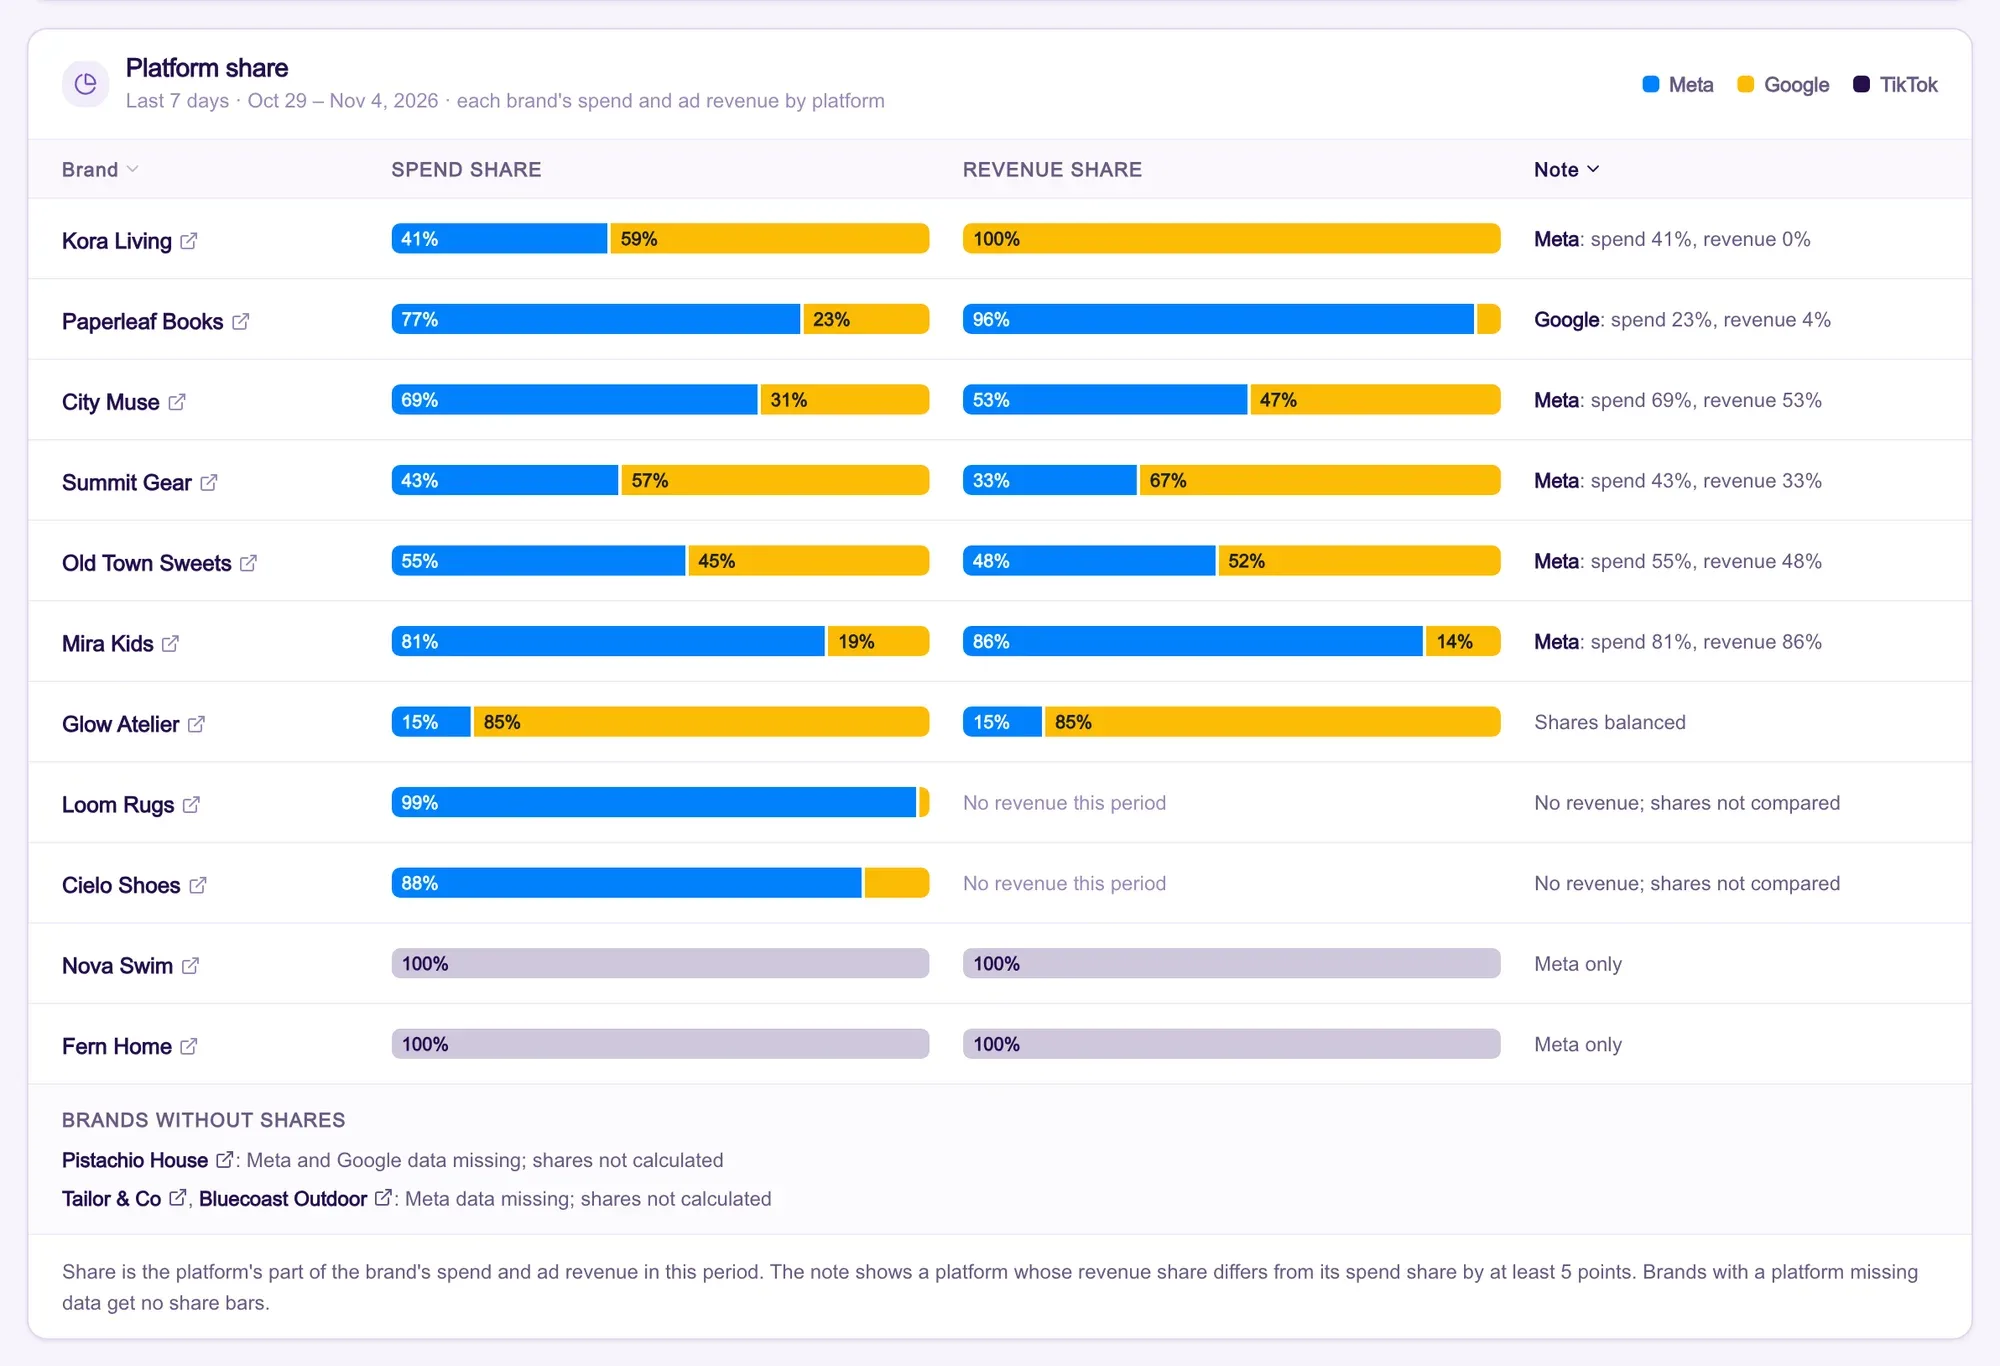
Meerkads adds a note only when the revenue share differs from the spend share by at least 5 points, so the column stays quiet unless there is something to discuss. Brands with a platform missing data get no share bars at all, because a missing account would shrink its share and inflate the others.
6. Performance by account manager
Agencies are run by people, and a portfolio view should show how each person's brands are doing. The Meerkads view shows a 12-week ROAS trend for each owner and a table with the last 7 and 30 days, the number of declining brands and the number of brands with issues.
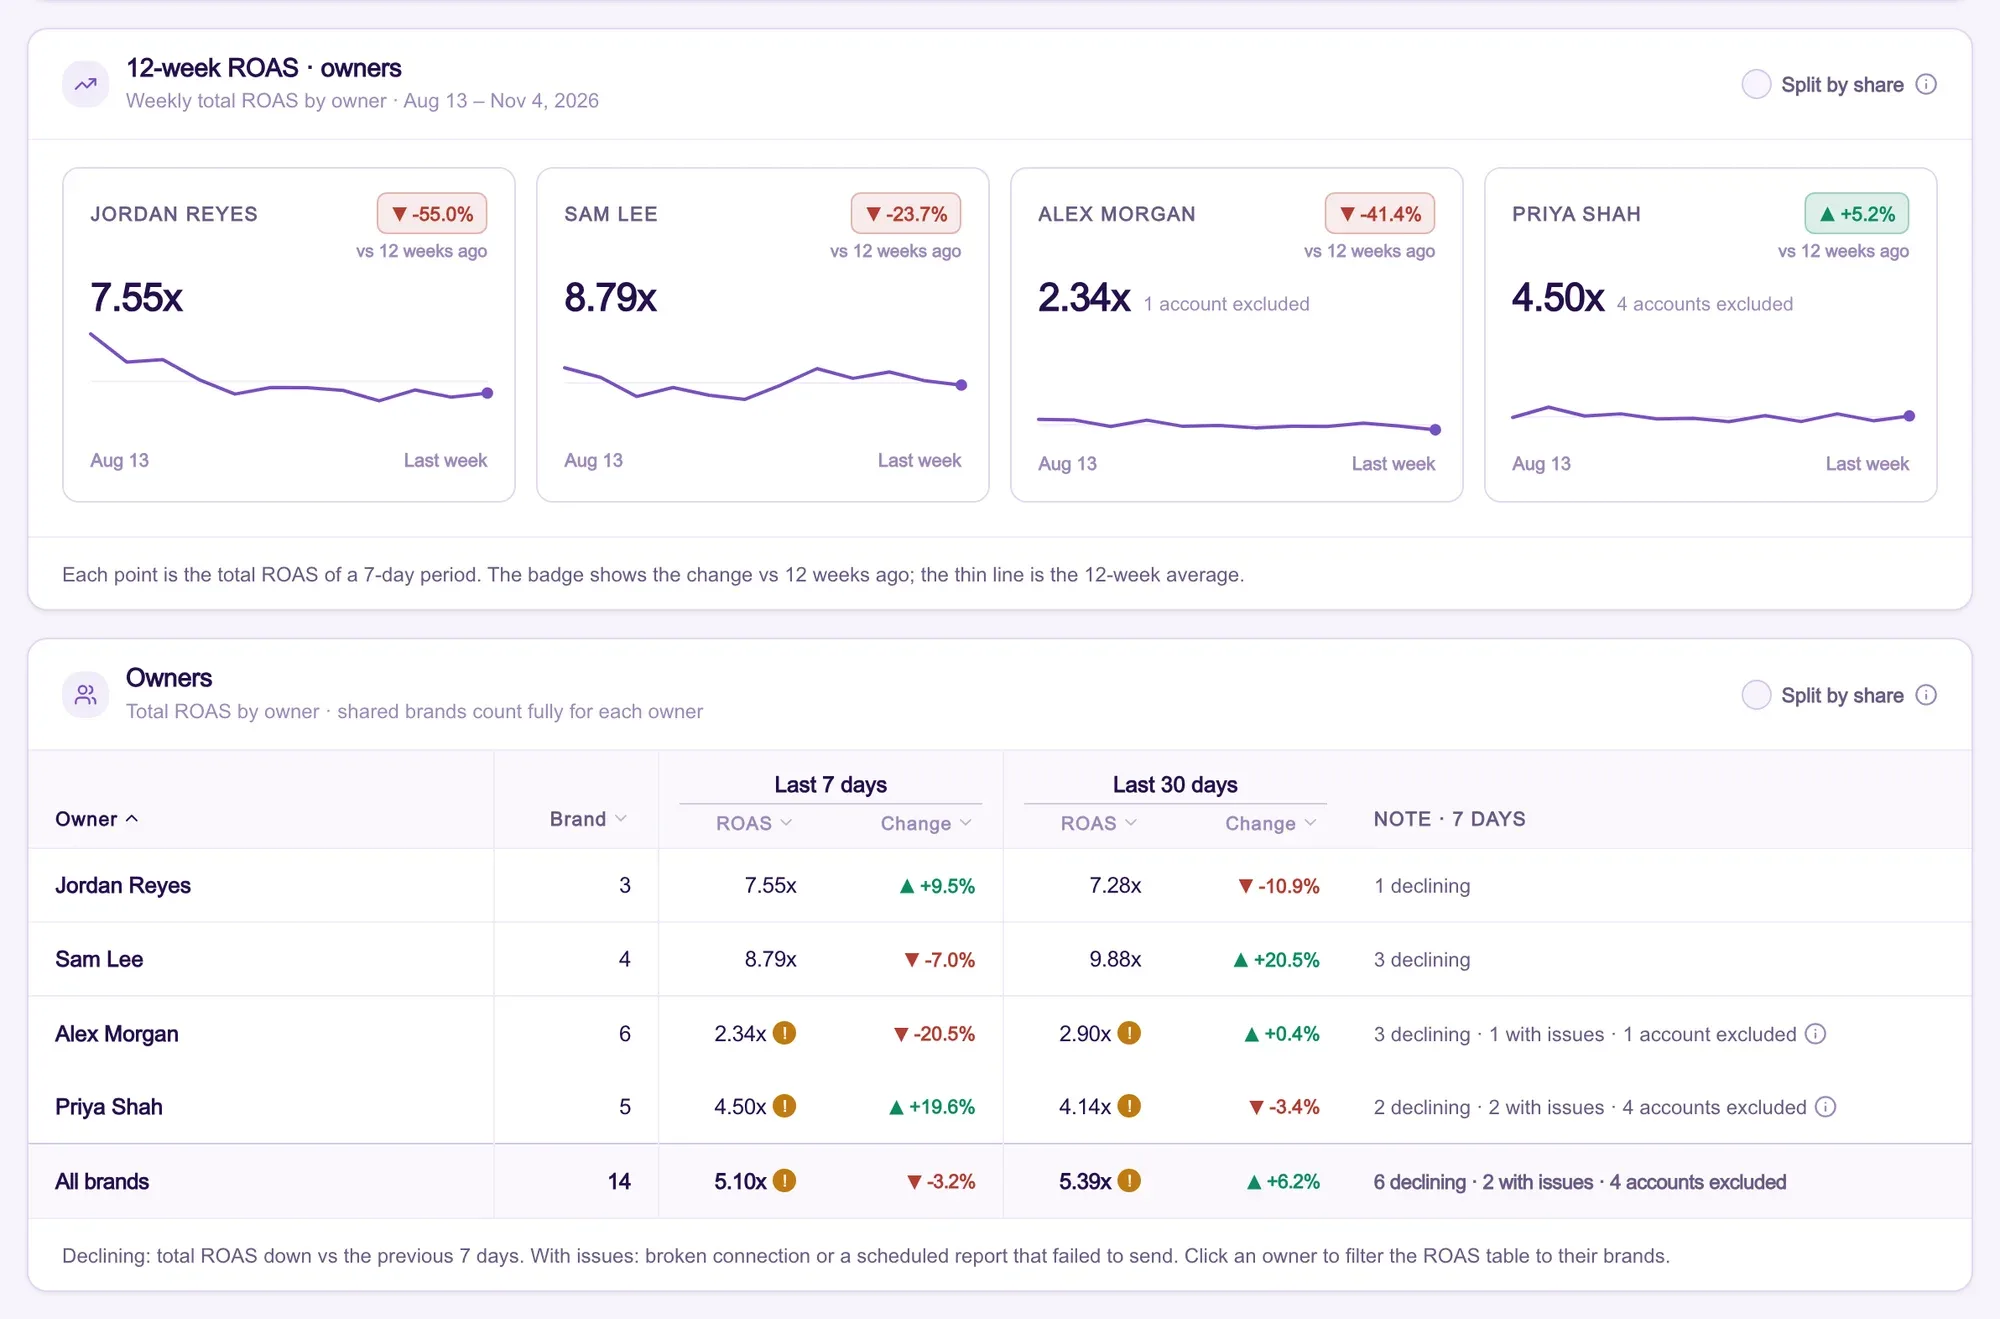
This is not about ranking people. Owners manage different kinds of clients, and ROAS levels differ by category. It is about workload and early support: if one account manager has three declining brands and two broken connections in the same week, that is where a lead should spend Monday afternoon. Clicking an owner filters the ROAS table to their brands.
A 15-minute weekly agency routine
A dashboard only helps if the team uses it the same way every week. Here is a simple routine for Monday morning.
- Fix data first (2 minutes). Reconnect broken accounts and check platform errors. Every other number depends on this.
- Work the critical list (5 minutes). Assign every critical issue to its owner with a deadline for today.
- Scan the ROAS table (5 minutes). Look at the brands with the biggest drops and check the trend line: one bad week or a slide?
- Check blended ROAS and platform share (2 minutes). Note any brand where platform numbers and store revenue disagree, or where spend and revenue shares have drifted apart.
- Review owners (1 minute). Spot overloaded portfolios and plan support.
Then export the PDF for the weekly team meeting, and let scheduled client reports go out on their own. If you want to know how much time manual reporting costs today, our guide to the hidden cost of manual reporting helps you estimate it.
How to choose agency reporting software
Most agency reporting tools were built to make client reports look good. Fewer were built to run an agency. Ask these questions before you commit:
- Does it show all clients on one screen? A tool that only works one client at a time is a client-report builder, not an agency dashboard.
- Does it put problems first? Look for alerts with clear severity levels, an owner and a direct action, not just charts.
- Does it handle broken data honestly? Ask what happens to totals when a connection fails. If the answer is "it shows zero", expect false alarms.
- Does it compare against real revenue? Platform-reported ROAS alone will mislead you, especially across several platforms.
- Does it support account managers? Owner assignment, filters by owner and portfolio-level views make the tool useful for the whole team, not just the founder.
- How fresh is the data? In Data Studio (formerly Looker Studio), Google Ads and Analytics data sources refresh every 12 hours, and that rate can't be changed. For catching problems the same day, you need more frequent syncs.
- What does it cost as you grow? Check how pricing scales with clients and connected accounts. Partner connectors for non-Google platforms in Data Studio may cost money to use, and those costs add up per client.
- Does it do white-label client reporting too? One tool for internal monitoring and external reports means one source of truth.
For a side-by-side view of common tools, see our comparison pages.
Common agency dashboard mistakes
- Building one dashboard per client. It looks organised, but nobody opens 14 dashboards every Monday. Start with the portfolio view and drill down.
- Averaging ROAS. Always calculate totals from summed spend and revenue.
- Trusting platform numbers alone. Put store revenue next to them for ecommerce clients.
- Alerts without owners. If an alert does not belong to someone, it belongs to no one.
- Too many alerts. If everything is red, nothing is. Use thresholds, such as a 15% ROAS drop, and keep critical for things that are truly broken.
- Ignoring data health. A broken connection that looks like a performance drop wastes hours of analysis.
Meerkads for agencies
We built the agency view in Meerkads around the routine above. When you manage several brands in Meerkads, the Weekly Performance view brings them together and shows:
- A Needs attention list with critical and warning levels, owners and one-click actions.
- ROAS by brand for Meta, Google and TikTok, with totals, changes and 12-week trends.
- Blended ROAS against Shopify revenue and platform share of spend and revenue.
- Owner views with 12-week trends, declining brands and issues per account manager.
- Data health built in: broken accounts are left out of totals, explained and linked to the fix.
- A PDF export for team meetings, plus scheduled, white-label client reports from the same data.
On top of that, Meerkads adds monitoring and alerts across channels and AI recommendations that explain what changed in each account and what to do next. See how it works for agencies and agency owners.
Frequently asked questions
What should an agency dashboard include?
At minimum: a list of issues that need action, performance by client and platform with period-over-period change, revenue-based metrics such as blended ROAS for ecommerce clients, and a view by account manager. Data health, meaning which accounts are disconnected or missing data, should be visible on the same screen.
What is the difference between an agency dashboard and a client dashboard?
A client dashboard shows one client's results, usually under your brand. An agency dashboard shows all clients together for your internal team, so you can prioritise work and catch problems early.
Can I build an agency dashboard in Data Studio or Looker Studio?
You can, but you will need connectors for each non-Google platform, a way to combine many accounts, and your own logic for totals, alerts and owners. Google's own data sources refresh every 12 hours. Many agencies start there and move to dedicated agency reporting software once they manage more than a handful of clients.
How often should agencies check their dashboard?
Critical alerts should reach you the same day. A structured portfolio review once a week, for example every Monday, is enough for trends, budget shifts and team workload.
How much does agency reporting software cost?
Pricing usually depends on the number of clients or connected accounts. Compare the total cost, including connectors and seats. See Meerkads pricing; every plan starts with a 7-day free trial.
Want to see the agency view with your own clients? Book a 20-minute demo or start your free trial.
Kardelen Yalduz · Growth Marketing SpecialistKardelen Yalduz is a Growth Marketing Specialist at Meerkads. Writes about agency reporting, performance marketing and growth.